Introducing Config Quest for Cribl: The All-in-One App for Configuration Visibility and Hygiene
If you’ve spent any time running Cribl Stream across large, enterprise environments, you already know the story. You start with a clean architecture: a couple of sources, a handful of pipelines, and a few well-defined routes. Fast-forward six months, and your deployment has expanded into dozens of Worker Groups, hundreds of routes, nested packs, and knowledge objects managed by multiple team members.
Suddenly, answering simple operational questions becomes a manual hunting exercise: Is this pipeline actually being used? Who modified this lookup table last week? Do we have configuration drift between our production and staging Worker Groups?
In large-scale observability setups, tracking configuration sprawl across distributed environments is notoriously tough. Poor configuration hygiene doesn’t just clutter your UI – it leads to orphaned pipelines, unrouted sources, and unaccounted-for drift across Worker Groups. That’s precisely why we’ve focused heavily on Cribl configuration management and building tools that make Stream hygiene effortless. Today, we’re walking through Config Quest for Cribl – a single place for Cribl administrators to search, browse, audit, and understand full configurations across every single Worker Group.
What is Config Quest for Cribl?
Config Quest for Cribl gives Cribl administrators a single pane of glass to search, browse, audit, and understand the full configuration across every Worker Group – including Pipelines, Routes, Sources, Destinations, Lookups, Packs, and all Knowledge objects.
Best of all, it’s strictly read-only. It never creates, modifies, or deletes any Cribl resource.
+-------------------------------------------------------------------+
|                        CONFIG QUEST APP                           |
+-------------------------------------------------------------------+
                                  |
   +------------------------------+------------------------------+
   |                              |                              |
   v                              v                              v
[ Global Search & Filter ]    [ Config Hygiene ]         [ Audit & Drift ]
Full-text query across        Automated checks for       Git history, commit log,
names, IDs, & values          orphaned/unrouted objects  & Worker Group drift matrix
Key Capabilities in This Release
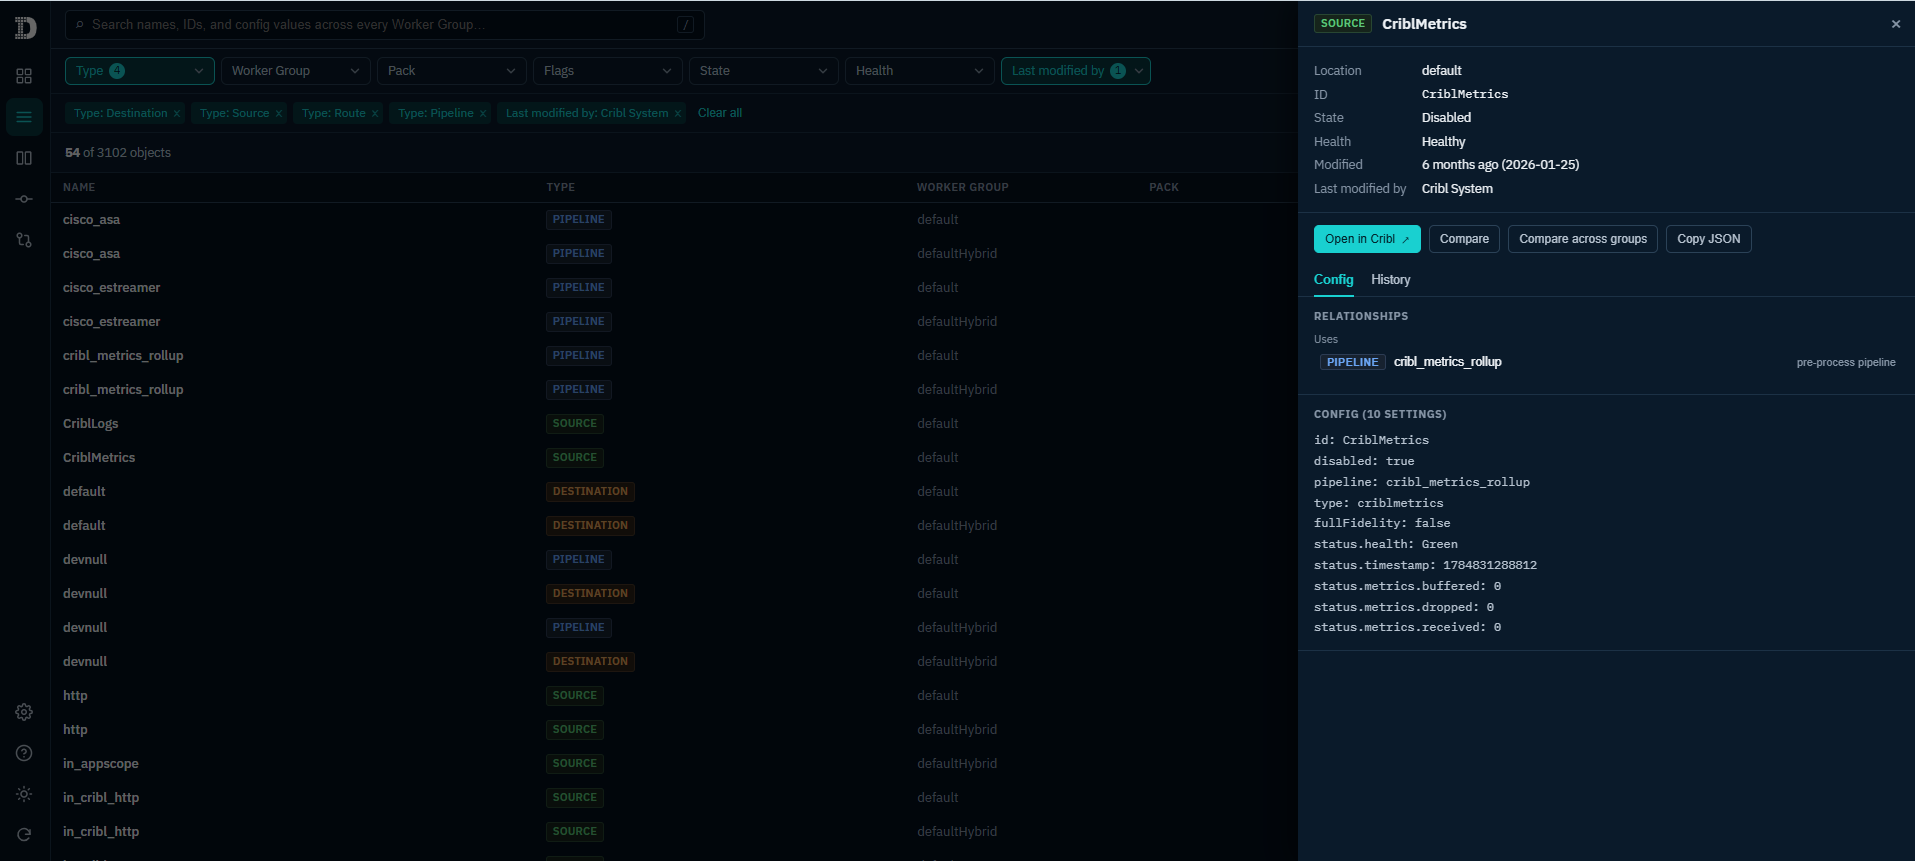
- Full-Text Search: Query across object names, IDs, and flattened configuration values across every Worker Group simultaneously.
- Browse & Filter: Filter by Type, Worker Group, Pack, State, Health, and last modified by – complete with one-click CSV export.
- Config Hygiene Findings: Automated flags for unreferenced pipelines, unresolved routes, unused lookups, dead-end sources/destinations, and disabled or stale objects – each assigned customizable severity tiers.
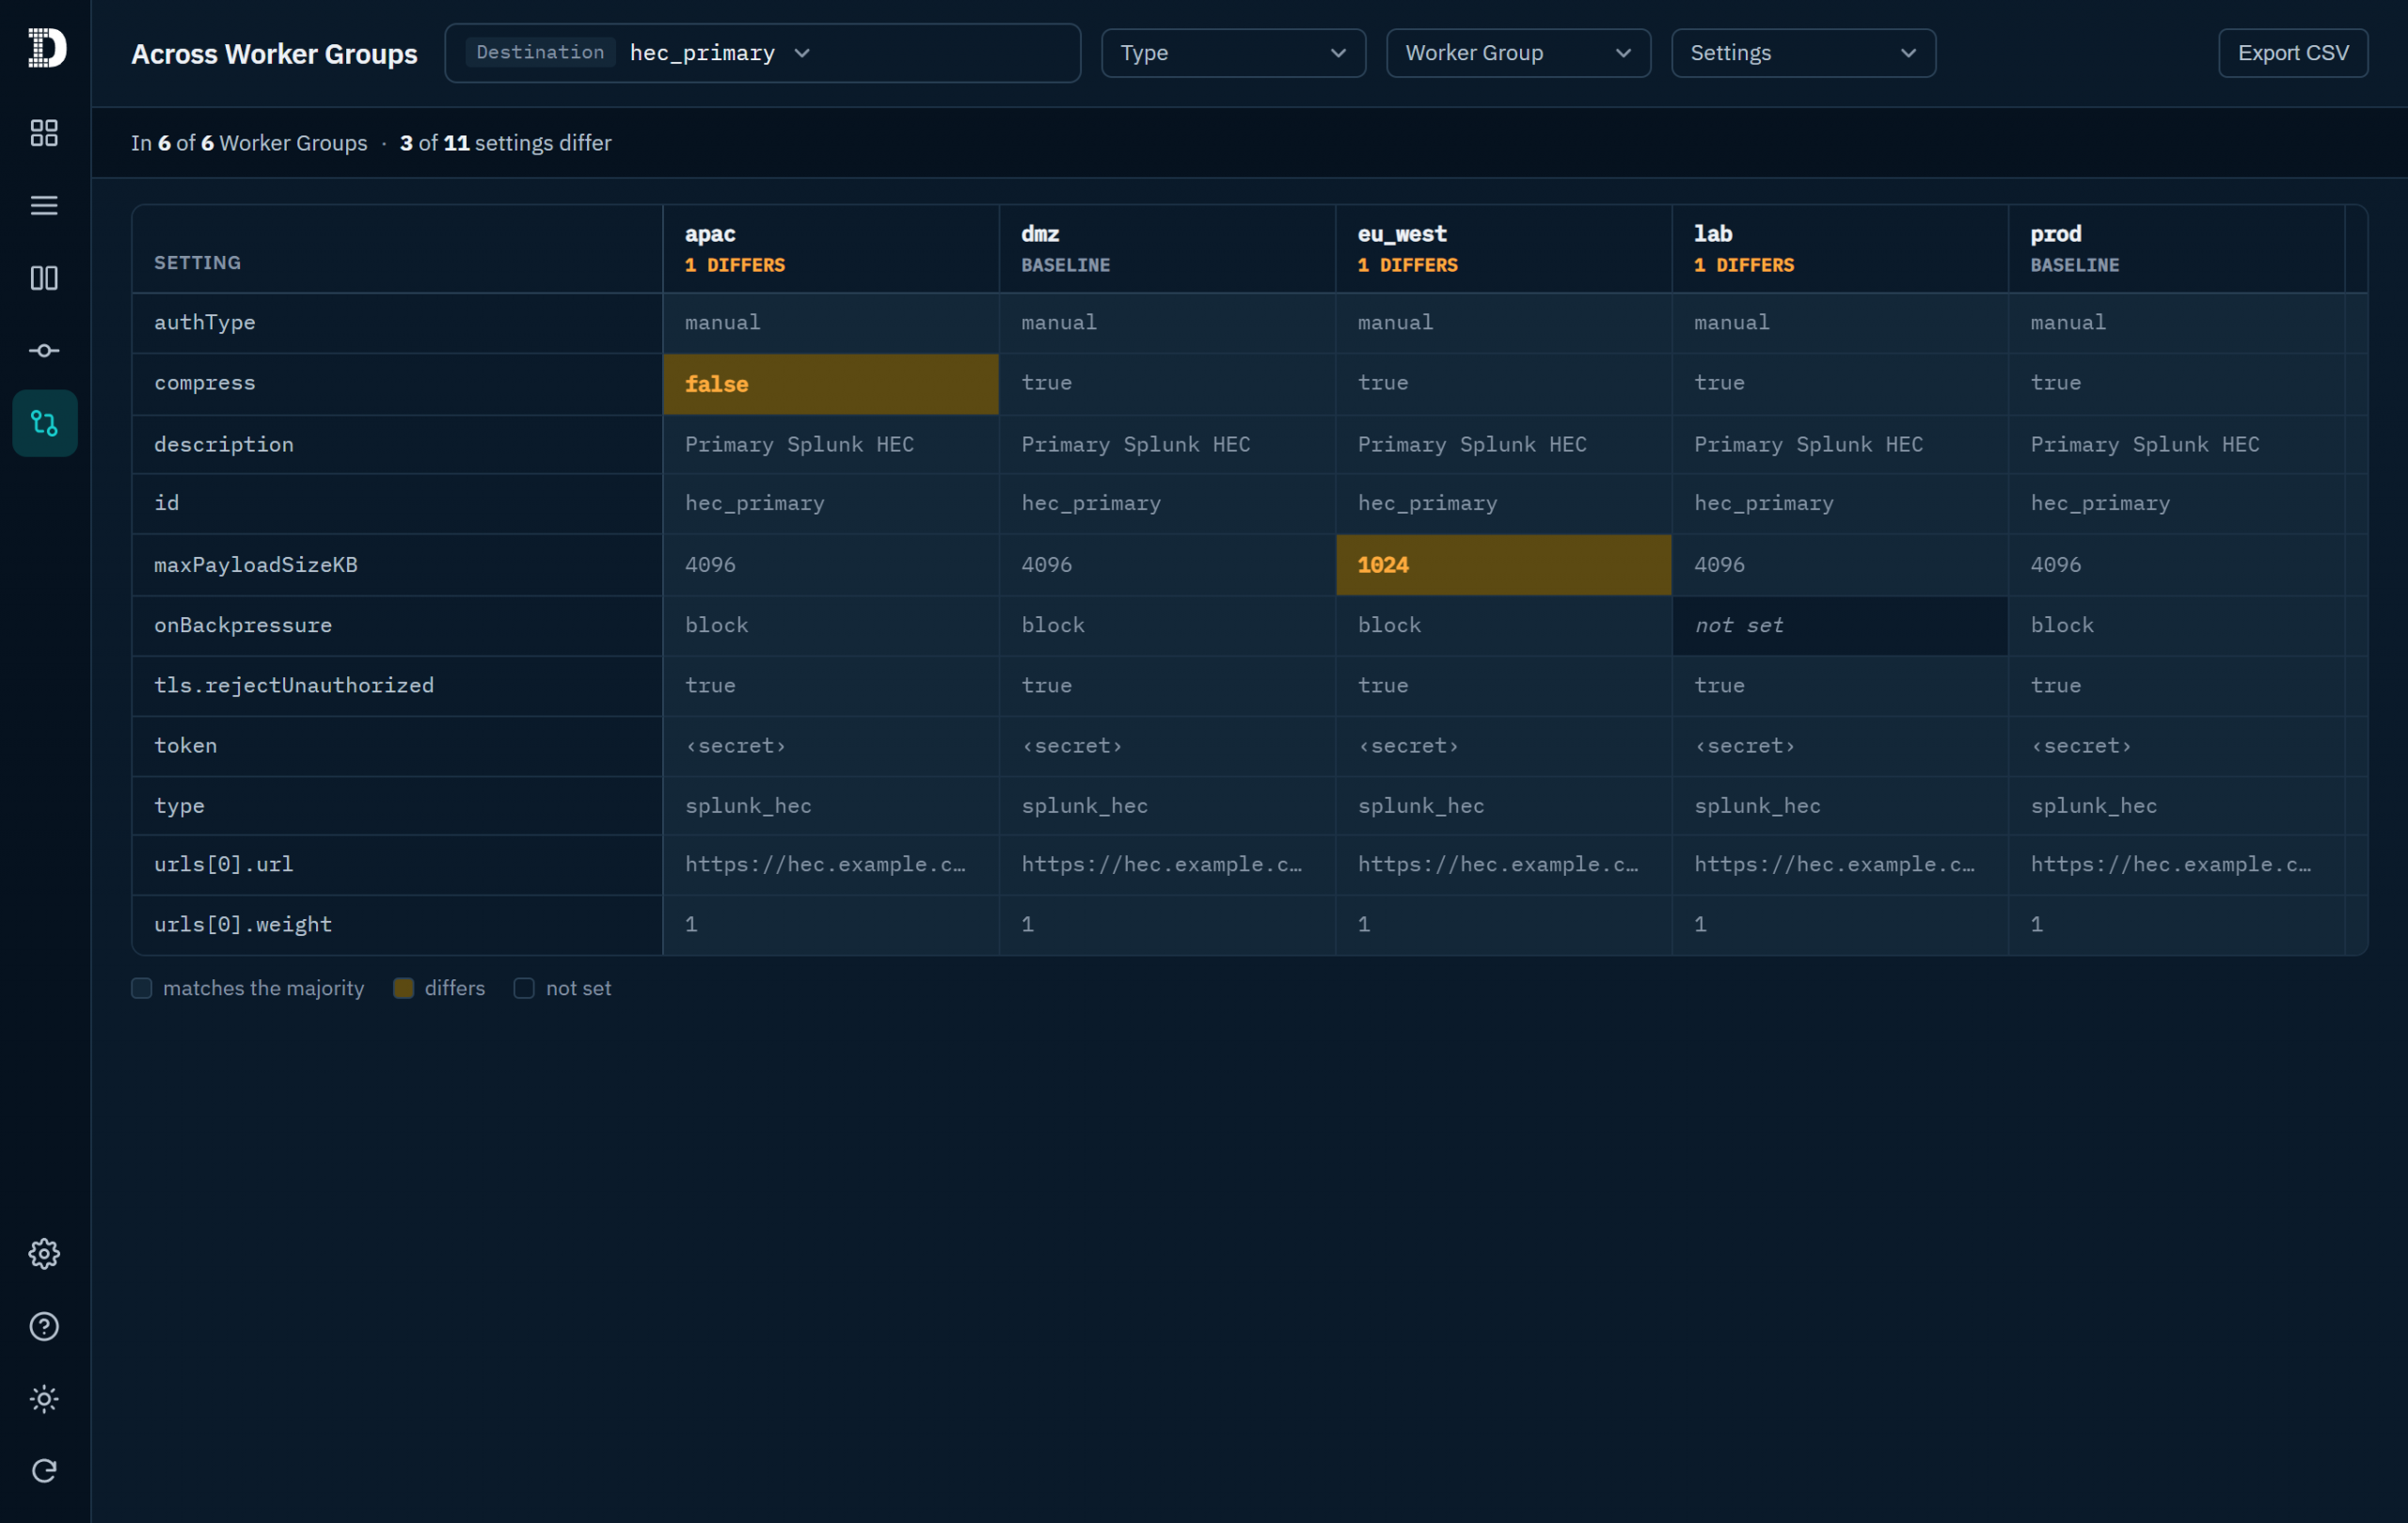
- Worker Group Drift Matrix: A dedicated settings × groups comparison matrix that highlights configuration differences across your Worker Groups at a glance.
- Side-by-Side Comparison: Compare any two objects of the same type side-by-side to quickly pinpoint setting variances.
- Git-Backed Change History: Inspect last-changed dates, commit authors, per-object diffs, and a full commit log browser powered directly by Cribl’s underlying Git versioning.
- Deep Linking: Use “Open in Cribl” deep links to jump straight from any object in Config Quest directly into the relevant Leader UI page.
Why Native Cribl Stream Hygiene Matters
When managing complex Cribl Stream environments, getting a true operational picture requires looking at configuration data holistically. By integrating directly into the Cribl App Platform, Config Quest for Cribl solves core configuration challenges natively.
1. Stopping Config Drift Across Worker Groups
As organizations scale, keeping Worker Groups synchronized becomes a constant battle. Config Quest for Cribl’s settings × groups matrix visualizes configuration differences instantly, showing you where settings have drifted between environments so you can fix inconsistencies before they impact data flow.
2. Automated Hygiene & Graph Inspection
Unreachable routes and orphaned pipelines quietly consume operational mental bandwidth. Config Quest for Cribl scans your setup to catch common structural issues before they cause incidents:
Common Hygiene Flags Caught:
- Dead-End Sources & Destinations: Active endpoints receiving or expecting data without proper route binding.
- Unresolved Routes: Routes that fail to resolve or sit behind catch-all rules.
- Unreferenced & Stale Objects: Unused pipelines, dormant lookups, and disabled objects sitting idle in your system.
3. Native Health Telemetry & Deep Integration
Rather than guessing whether an object is operational, Config Quest for Cribl pulls real-time health statuses per object directly from the Leader’s status endpoints. When you spot an anomaly, deep links take you straight to that object in the Leader UI for immediate remediation.
Built for Security: Read-Only by Design
We know that enterprise administrative tools must adhere to strict security posture requirements. Config Quest for Cribl is engineered with a zero-risk footprint:
- Strictly Read-Only: All API paths declared in the app’s policies.yml use GET actions. The app cannot modify or delete your Cribl infrastructure.
- No External Footprint: Config Quest for Cribl makes zero external API calls and requires no external credentials.
- Transparent Permissions: When installing, Cribl displays every declared API path upfront for administrator review.
Overview Dashboard & Getting Started
Getting started with Config Quest for Cribl takes less than a minute. Upon first opening, the app indexes your configuration – a one-time background build that typically completes in under 60 seconds. Subsequent opens load instantly from the cached index, which is shared seamlessly across all authorized users in your organization.
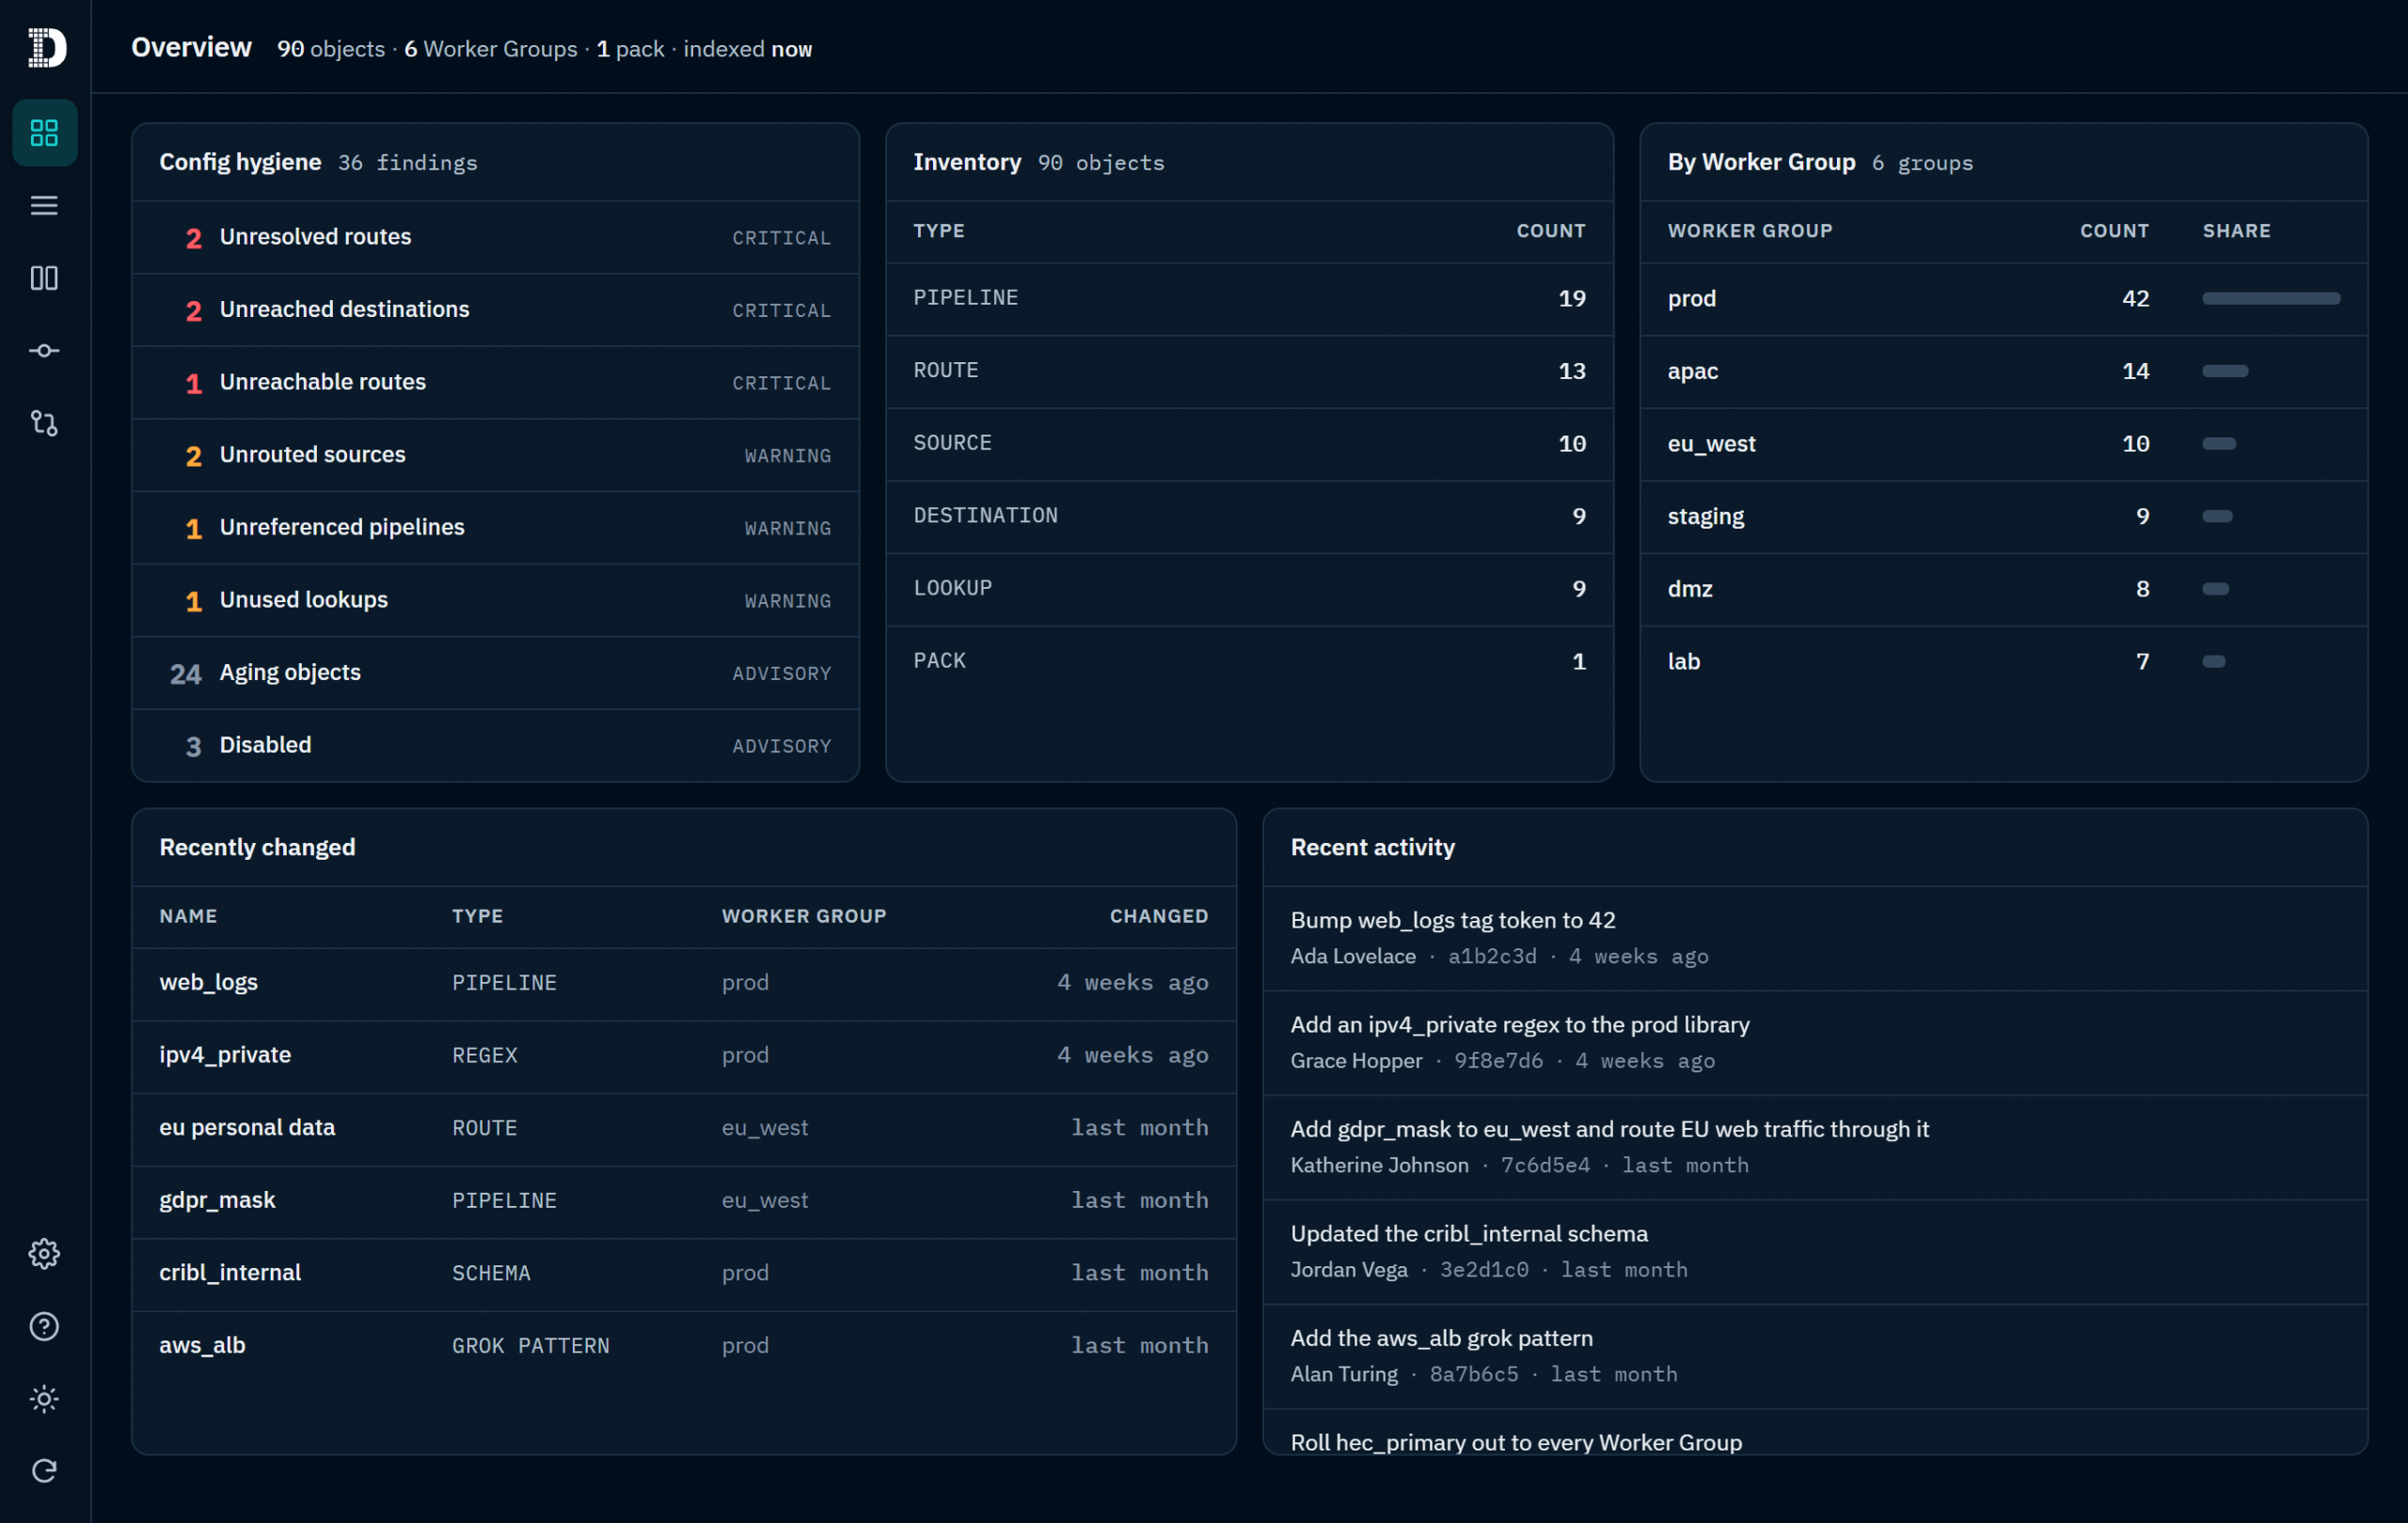
Once indexed, the Overview page gives operators an at-a-glance readout:
- Hygiene Summary: Active warnings and critical findings.
- Fleet Inventory & Health: Complete object breakdown and telemetry status.
- Audit Activity: Recent configuration changes and the latest commit history.
Summary & Next Steps
Proactive Cribl configuration management shouldn’t require manual spreadsheet auditing or clicking through dozens of Worker Group sub-menus. With Config Quest for Cribl, you gain instant full-text search, automated hygiene findings, and full commit history – all within a secure, read-only interface.
Requirements for installation are simple: you need Cribl Stream (with the Cribl App Platform available in your organization) and an Organization Administrator role to install.
Want to clean up your Stream deployment and eliminate config drift? Contact our data observability experts today to learn more or request a walkthrough of Config Quest for Cribl.
Available on GitHub
Config Quest for Cribl Repository