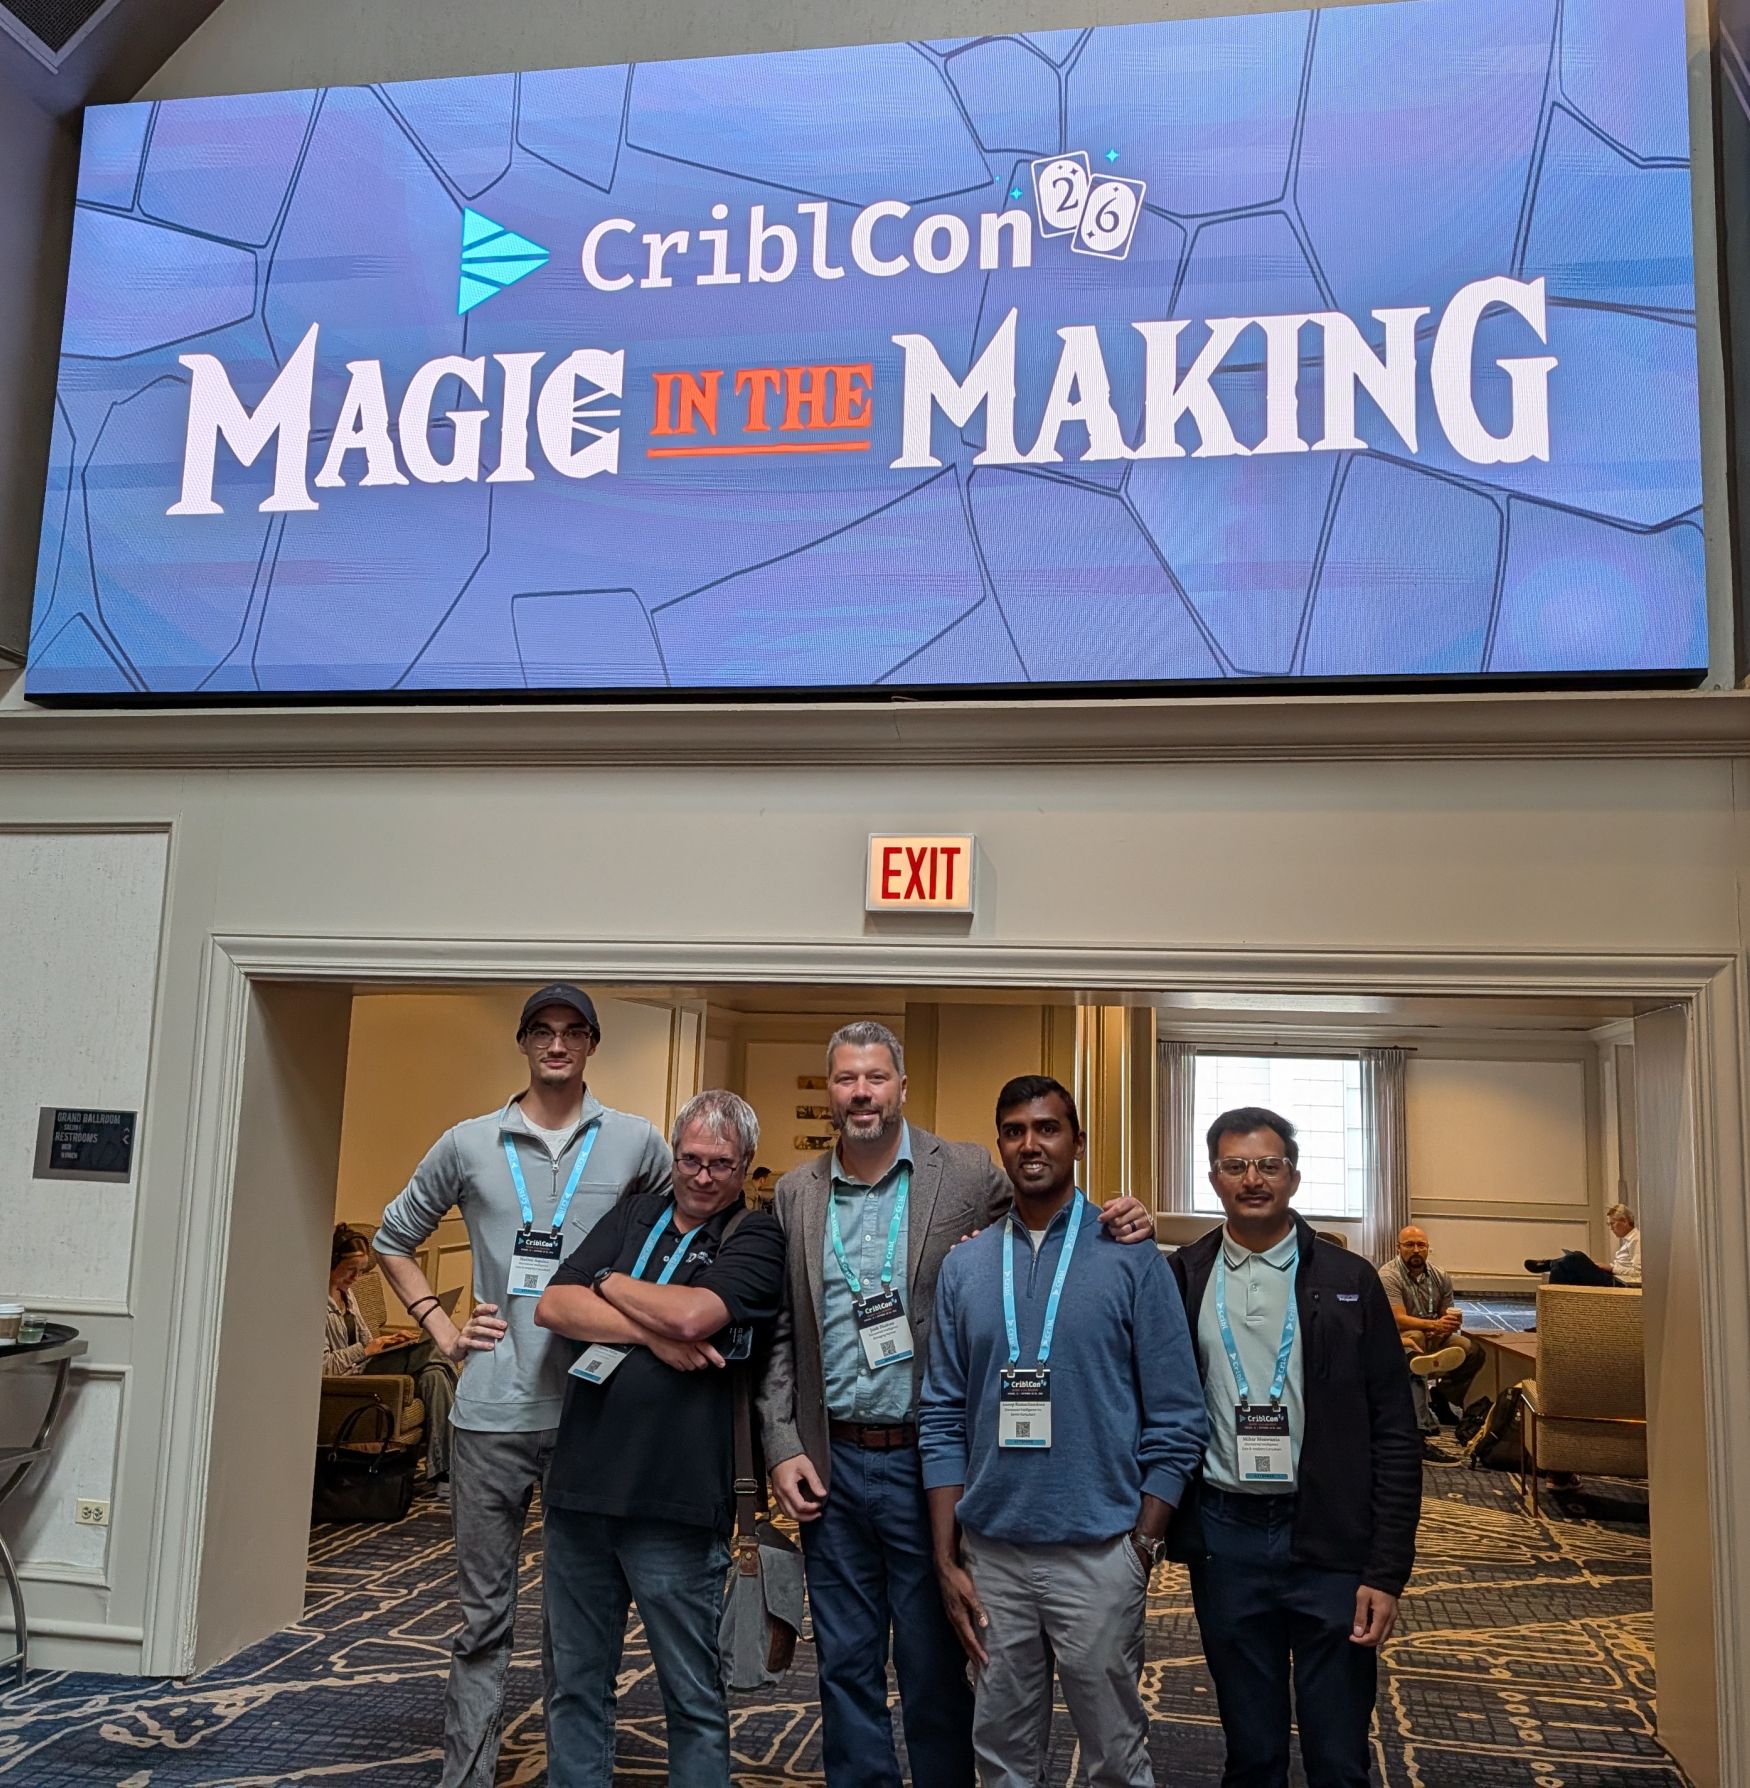
Last week, our team had the opportunity to travel to Chicago to attend CriblCon 26, and hear some exciting announcements about what’s to come, as well as real-world stories from Cribl Customers and partners. The sessions focused on shifting from complexity to integrated, intelligent platforms.
As expected, AI was a prominent focal point across discussions and messaging, in most cases positioned for minimizing risk, enhancing monitoring, and optimizing complex workflows. However, seeing how heavily customers, and vendors, are relying on underlying models (like Anthropic) immediately raises data security concerns. The scope of access these AI agents require means there will be a massive demand for developing tighter control layers and greater visibility, whether through custom Model Context Protocols (MCPs), stringent policy enforcement, or comprehensive AI governance.
The new Cribl Apps development framework takes the bespoke engineering aspect of the past and places it directly into the hands of admins and users, with the capability to build apps, workflows and agents using natural language. The rapid evolution of the App development framework is promising, particularly the initiative to lower the barrier to entry with powerful features like backend compute and a centralized app marketplace with over 150 solutions from Cribl, partners, and customers.
Our team has been closely partnered with Cribl on this new feature and are most excited about the value this can unlock for customers and partners. You can find some of our very own Cribl App’s on the the Cribl Marketplace today:
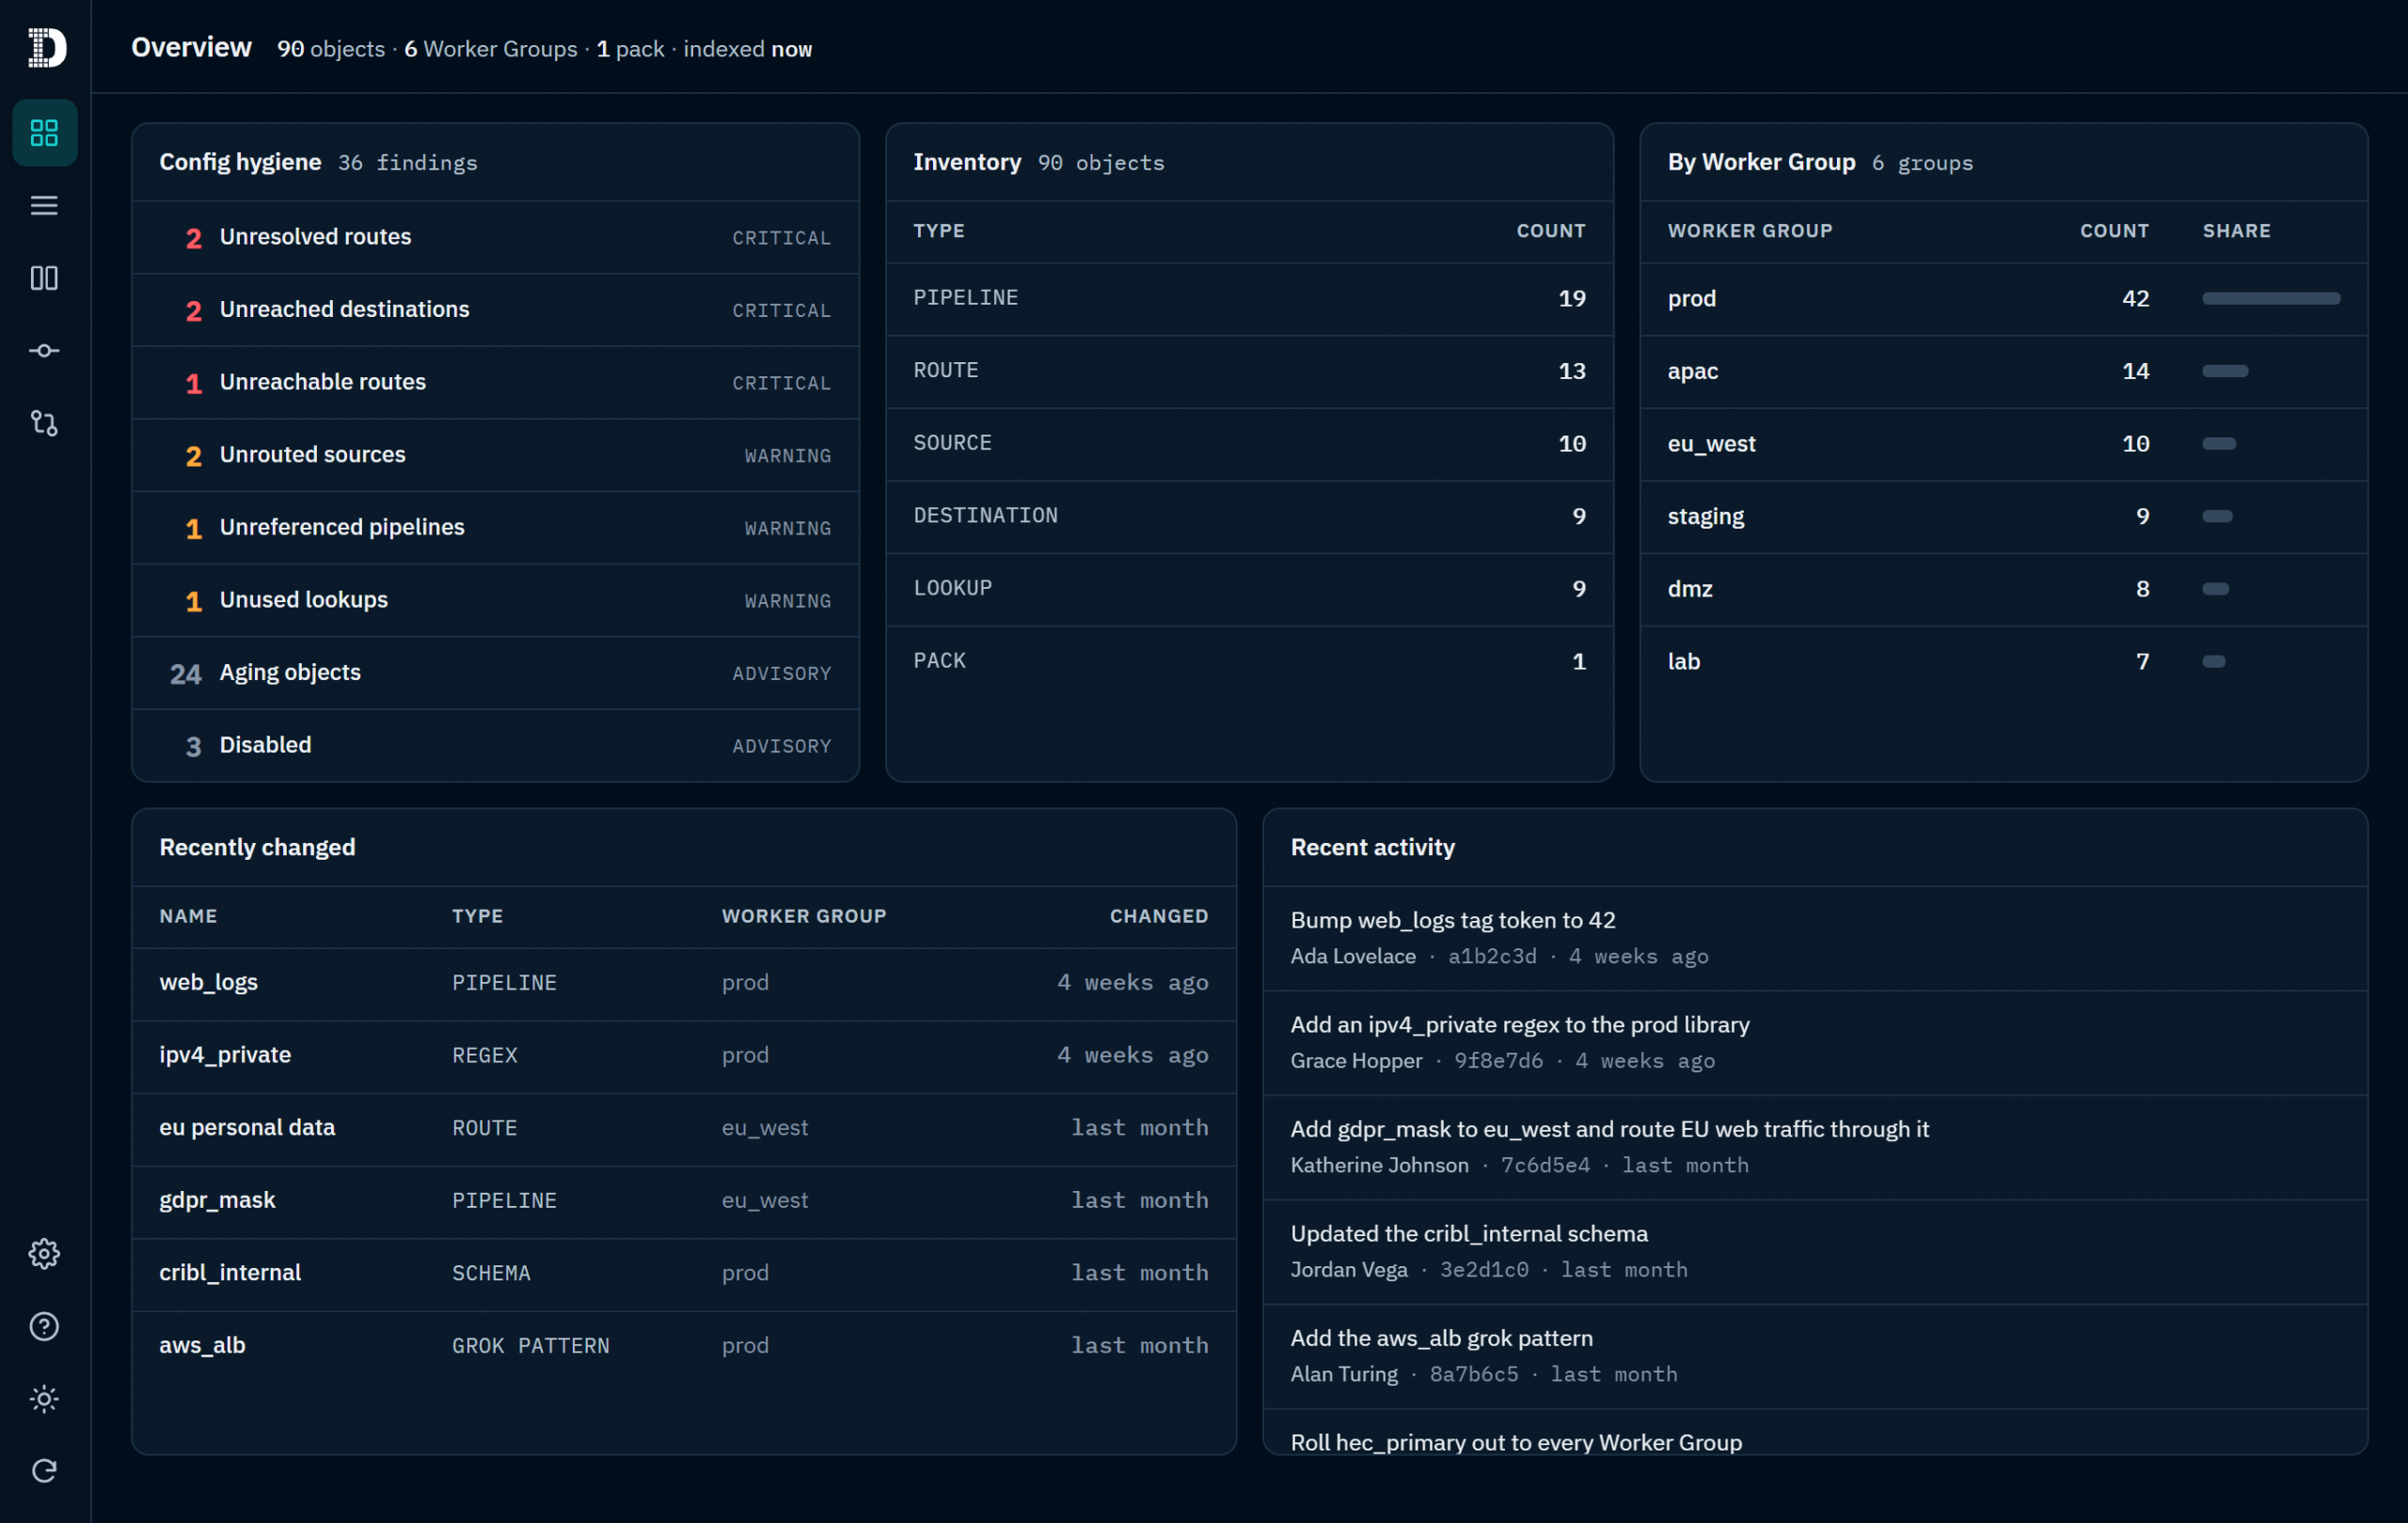
Config Quest for Cribl – Configuration and knowledge object visibility, search, and hygiene for Cribl, running natively inside the Cribl App Platform.
Data Flow Monitor for Cribl – End-to-end visibility into your Cribl data flows from every Source, through each Route, Pipeline, and Function, to every Destination.
AI-powered Parsing
It was eye-opening to see how easily data can now be ingested directly into Cribl Search. By using AI to auto-parse the telemetry and send it straight to a dataset, you can bypass Cribl Stream for certain workflows, streamlining the path from raw data to actionable intelligence. Beyond automatic normalization at ingest, it can unify telemetry with human context from tools such as ServiceNow and Jira to further enhance investigations.
This was the big one and certainly got the most interest from attendees.Cribl Detect transforms the Cribl platform into a full-fledged SIEM. Cribl Detect comes from Cribl’s acquisitions of CadinalOps and Radiant Security’s AI SOC technology, which Cribl has wasted no time into turning into a viable solution for customers. It will offer in-stream threat detection before data is even stored, and federated search across existing data lakes, leveraging the telemetry you already have regardless of where that data lives. Moving beyond detection, Cribl Detect will also include coverage and posture management to provide teams the assurance that they are prepared for the threats they most care about.
Cribl Detect is available now for Cribl Cloud customers.
Managing the complexity of enterprise AI usage is a growing headache, and this announcement is anticipated to be the solution. Cribl StreamAI will provide intelligent model routing, AI traffic governance, and real-time cost controls to ensure every prompt goes to the right model at the right price, bringing much-needed oversight to LLM workloads. Additionally, Cribl StreamAI will provide the capability to shield sensitive information in outgoing prompts and incoming responses, recording every model call and routing decision for complete governance across all AI traffic.
General availability is slated for early 2027, which can’t come soon enough based on the interest we saw from attendees!
Wrapping Up
CriblCon 2026 proved that the observability and security landscape is shifting fast. With major strides in AI governance, streamlined data parsing, and entry into the SIEM market with Cribl Detect, the focus is no longer just on managing data – it’s about making it work smarter and safer. We’re looking forward to seeing these new capabilities in action and how they reshape the industry in the year ahead.
Discovered Intelligence Inc., 2026. Unauthorized use and/or duplication of this material without express and written permission from this site’s owner is strictly prohibited. Excerpts and links may be used, provided that full and clear credit is given to Discovered Intelligence, with appropriate and specific direction (i.e. a linked URL) to this original content.
https://discoveredintelligence.com/wp-content/uploads/2026/10/PXL_20260930_191359739-scaled-e1791466316981.jpg17881750Discovered Intelligencehttps://discoveredintelligence.com/wp-content/uploads/2013/12/DI-Logo1-300x137.pngDiscovered Intelligence2026-10-09 13:15:172026-10-09 13:15:19Key Takeaways from CriblCon 2026
Traditionally, we have had to solve complex data or security workflows by using multiple browser tabs, complicated spreadsheets, and many internal messages. IT, Security, and DevOps environments are drowning in high-velocity telemetry, fragmented tooling, and growing AI-driven data demands. Even though Cribl Stream, Search, and Lake give us control over our data, we sometimes still hit a wall when trying to deliver tailored solutions, as the standard out-of-the-box dashboards don’t fit every workflow required.
We were excited to hear that Cribl introduced app-building directly into the platform. In this post, we’ll dive into what the Cribl App platform can do, the challenges it can address, and some practical tips to help you build reliable, native apps.
What a Cribl App is…and What It Isn’t
Before we start slinging code, let’s make sure we define when an App is needed versus a Pack.
Cribl Packs package and share reusable configuration content – like Sources, Routes, Pipelines, and Knowledge Objects. They structure data inside Cribl’s native engines.
Cribl Apps package custom user interfaces, interactive workflows, state, and logic that execute directly against Cribl APIs. They run as sandboxed web applications right inside the Cribl Cloud UI, with the option to reach out externally through APIs as well.
Apps are built within the Cribl platform, leveraging existing platform functionality. For example, Stream is used for collection and routing, Search for analysis, and Lake for storage. There’s no new infrastructure or license fee, as apps draw down credits from the underlying products.
In summary, if you just need out-of-the-box routing rules or standard search views, use Packs, and if you need a standalone, interactive experience with custom workflows, persistent state, and specialized API logic, go forward with an App.
Navigating the Framework Boundaries
There are some strict boundaries to consider when you build an app. Taking this into consideration prior to building could save you a substantial amount of time.
Cribl Apps run inside an iframe in the browser and can have backend functions of their own that run on user-defined schedules. Since runtime network requests can’t reach arbitrary external hosts, you need to bundle all assets (fonts, icons, dependencies) inside your package.
Permissions
An app requires an explicit manifest declaring every Cribl API route it intends to call and every external host it needs to reach via the platform proxy. Backend functions and any cron schedules must also be declared.
The local fixture-driven development server will ignore missing permissions, but the moment you deploy to a live environment, an undeclared API call will fail outright. Ensure you always declare your permissions when you write the code.
Shared Key-Value Storage
If your app needs to remember data such as user settings, approval states, or triage notes, the platform provides a shared key-value store. The store is app-scoped, not user-partitioned. Any state written by one user will be visible to all users who open the app. Never store unmasked credentials or sensitive information.
Practical Engineering Methods
Building an app that demos well on a local dev server is one thing, but shipping an app that survives a production environment requires discipline. Here are some practical guildelines to help ensure success:
1. Don’t Rely on Local
Local fixtures hide permission enforcement failures, storage cap bugs, live API payload nuances, and real-world latency. Package and deploy a minimal working slice to a real test environment early and frequently.
2: Presentation
When an API call returns empty, or a user lacks permission for a specific scope, don’t let it crash the view or surface a raw stack trace. Make sure a clean, contextual empty state is displayed. Partial access should still deliver partial value.
3: Build Trust
Help build trust for your users by ensuring the app looks, feels, and writes like the host platform:
Use standard product terminology.
Follow light/dark themes and use restrained accent colors.
Implement deep links back into native tools whenever referencing specific data.
Keep text clear, inclusive, and professional.
4: Implement a Pre-Ship Gate
Before tagging a release, run an exhaustive audit:
Ensure type-checks, lints, and test suites run 100% green.
Audit source code and packaged archives to ensure no stray credentials, developer hostnames, or test tokens remain.
Verify that every declared permission in your manifest is actively used, and every used route is explicitly declared.
The Cribl app-building framework offers us a whole new dimension of observability engineering. By decoupling your user interfaces from standard vendor constraints, you can build tailored, repeatable workflows directly on top of your existing telemetry pipelines. No matter what you’re building, remember: keep your app scoped, sandboxed, and tested against live environments.
Discovered Intelligence Inc., 2026. Unauthorized use and/or duplication of this material without express and written permission from this site’s owner is strictly prohibited. Excerpts and links may be used, provided that full and clear credit is given to Discovered Intelligence, with appropriate and specific direction (i.e. a linked URL) to this original content.
https://discoveredintelligence.com/wp-content/uploads/2026/09/Cribl-App-Dev-Blog.png12001200Mihir Meswaniahttps://discoveredintelligence.com/wp-content/uploads/2013/12/DI-Logo1-300x137.pngMihir Meswania2026-10-08 10:48:002026-10-08 15:20:40Tips For Diving Into The New Cribl App Development Framework
If you are running a modern SOC or managing complex infrastructure, you are likely drowning in a sea of raw logs. Sorting through this data to isolate an incident takes valuable time—time you don’t have when a potential breach is unfolding. What if you could instantly translate those technical logs into plain, actionable language right inside your search pipeline? Sounds simple, right?
With the release of the Splunk AI Toolkit, this capability is something you can implement today. By bringing generative AI directly into the Search Processing Language (SPL) pipeline via the | ai command, Splunk allows you to send search results to a Large Language Model (LLM) and parse the response as a native field. However, before you go pointing an LLM at your production data streams, there are critical performance and data governance hurdles you need to consider. Let us dive into how the toolkit works, how to use it effectively, and how to keep your data secure.
Mastering the Splunk AI Toolkit Setup
The Splunk AI Toolkit (formerly known as the Machine Learning Toolkit) integrates public and private generative AI platforms into your existing Splunk workflows. To get this up and running, your environment must meet a few baseline infrastructure requirements:
Splunk Platform: Splunk Enterprise or Splunk Cloud version 9.1 or later.
Python for Scientific Computing: You must install this specific add-on on your search head, as it serves as the underlying interface between Splunk and external AI services.
Permissions: You will need an administrator account with the MLTK admin role to configure AI connections and manage access controls.
Once the prerequisites are checked, you use the Connection Management UI within the app to hook up your LLM providers. You simply input your provider API keys or tokens, define your endpoints, and set up your default models. The toolkit supports a wide variety of models, including Google Gemini, OpenAI, Anthropic Claude, Microsoft Azure, and Amazon Bedrock.
Choosing the right model depends entirely on your specific task. For example, we find that Google’s Gemini models are highly economical and fast for summarizing large volumes of event logs, while Claude often excels at interpreting complex code or generating highly precise configurations.
Three Game-Changing Use Cases for DevSecOps
Once your connection is active, the real magic happens in the search bar. By appending the | ai command to your queries, you can transform how your team triages incidents. Here are three practical ways we use the toolkit to optimize daily operations:
1. Automated Field Extraction for Unfamiliar Logs
Onboarding a new, unstructured log source usually requires writing tedious regular expressions (regex). The Splunk AI Toolkit can analyze a messy log sample and automatically generate a usable regex pattern for you.
Pro Tip: Don’t treat AI regex as production-ready code. It is an excellent starting point to speed up early-stage pipeline analysis, but you should always validate the pattern against a larger dataset and use the native rex command for final production deployment.
2. High-Speed Event Summarization
When an outage occurs, your on-call engineers do not have time to look up obscure error codes across five different vendor documentation sites. You can pass error logs directly to the LLM to get an executive-ready brief of what went wrong. By strictly formatting the prompt to return clean JSON data, you can seamlessly feed these summaries into corporate Slack channels, IT support tickets, or daily ops updates.
3. Contextual Anomaly Detection
Splunk’s native math functions are fantastic at calculating standard deviations and identifying metric spikes. However, numbers alone do not give you context. By passing an aggregated numeric array (like a 5-minute volume bucket) to the LLM, the toolkit can explain the spike relative to your historical baseline in plain language. This gives your security analysts instant, clear documentation to include in incident triage tickets.
Solving the GenAI Data Security Dilemma
The benefits of generative AI are clear, but if you are working in a regulated industry, you are probably asking a critical question: What happens to our data when it leaves our network?
+----------------------------------------------------------------------+
|                     THE GENERAL DATA PRIVACY RISK                    |
|                                                                      |
|  [ Your Secure Logs ] ---> ( Public API Endpoint ) ---> [ Cloud LLM ] |
|                                                              |       |
|                                                              v       |
|                                                    Data Retained for |
|                                                    Model Training!   |
+----------------------------------------------------------------------+
Sending raw log files to public endpoints poses serious compliance and legal risks. Sensitive data like Personally Identifiable Information (PII), access tokens, or proprietary system architectures could be logged and retained by external vendors for model training.
To mitigate these risks, we highly recommend adopting a Zero-Egress architecture by routing your Splunk AI Toolkit queries to a localized LLM (such as an on-premise Ollama instance running Llama 3).
+-----------------------------------------------------------------------+
|                     ZERO-EGRESS LOCAL ARCHITECTURE                     |
|                                                                       |
|  [ Splunk Enterprise ] ---> ( Local Network ) ---> [ On-Prem Ollama ]  |
|                                                              |        |
|                                                              v        |
|                                                    Data Never Leaves  |
|                                                    Your Corporate DMZ  |
+-----------------------------------------------------------------------+
Running your models locally ensures that your data never exits your corporate security boundary. Additionally, you can utilize Single Sign-On (SSO) and role-based access control (RBAC) to ensure that the AI only retrieves and processes data that the executing user is explicitly permitted to see. Keep in mind that running local models requires dedicated hardware considerations—specifically, sufficient GPU memory to handle concurrent user queries and large token context windows.
Summary and Next Steps
The Splunk AI Toolkit is a powerful asset for teams looking to accelerate log analysis, automate regex creation, and enrich incident alerts with natural language context. However, the key to a successful deployment lies in balancing operational speed with strict data governance. By aggregating your data before sending payloads and utilizing local LLM models where data privacy is paramount, you can enjoy the best of both worlds: cutting-edge efficiency and uncompromised security.
Discovered Intelligence Inc., 2026. Unauthorized use and/or duplication of this material without express and written permission from this site’s owner is strictly prohibited. Excerpts and links may be used, provided that full and clear credit is given to Discovered Intelligence, with appropriate and specific direction (i.e. a linked URL) to this original content.
https://discoveredintelligence.com/wp-content/uploads/2026/08/Copy-of-Splunk-AI-Toolkit-v2-7.png20002000Matteo Aquinohttps://discoveredintelligence.com/wp-content/uploads/2013/12/DI-Logo1-300x137.pngMatteo Aquino2026-08-07 14:42:512026-08-10 14:37:43Boosting Sec Ops Efficiency: A Practical Guide to the Splunk AI Toolkit
If you’ve spent any time running Cribl Stream across large, enterprise environments, you already know the story. You start with a clean architecture: a couple of sources, a handful of pipelines, and a few well-defined routes. Fast-forward six months, and your deployment has expanded into dozens of Worker Groups, hundreds of routes, nested packs, and knowledge objects managed by multiple team members.
Suddenly, answering simple operational questions becomes a manual hunting exercise: Is this pipeline actually being used? Who modified this lookup table last week? Do we have configuration drift between our production and staging Worker Groups?
In large-scale observability setups, tracking configuration sprawl across distributed environments is notoriously tough. Poor configuration hygiene doesn’t just clutter your UI – it leads to orphaned pipelines, unrouted sources, and unaccounted-for drift across Worker Groups. That’s precisely why we’ve focused heavily on Cribl configuration management and building tools that make Stream hygiene effortless. Today, we’re walking through Config Quest for Cribl – a single place for Cribl administrators to search, browse, audit, and understand full configurations across every single Worker Group.
Config Quest for Cribl gives Cribl administrators a single pane of glass to search, browse, audit, and understand the full configuration across every Worker Group – including Pipelines, Routes, Sources, Destinations, Lookups, Packs, and all Knowledge objects.
Best of all, it’s strictly read-only. It never creates, modifies, or deletes any Cribl resource.
+-------------------------------------------------------------------+
|                        CONFIG QUEST APP                           |
+-------------------------------------------------------------------+
                                  |
   +------------------------------+------------------------------+
   |                              |                              |
   v                              v                              v
[ Global Search & Filter ]    [ Config Hygiene ]         [ Audit & Drift ]
Full-text query across        Automated checks for       Git history, commit log,
names, IDs, & values          orphaned/unrouted objects  & Worker Group drift matrix
Key Capabilities in This Release
Full-Text Search: Query across object names, IDs, and flattened configuration values across every Worker Group simultaneously.
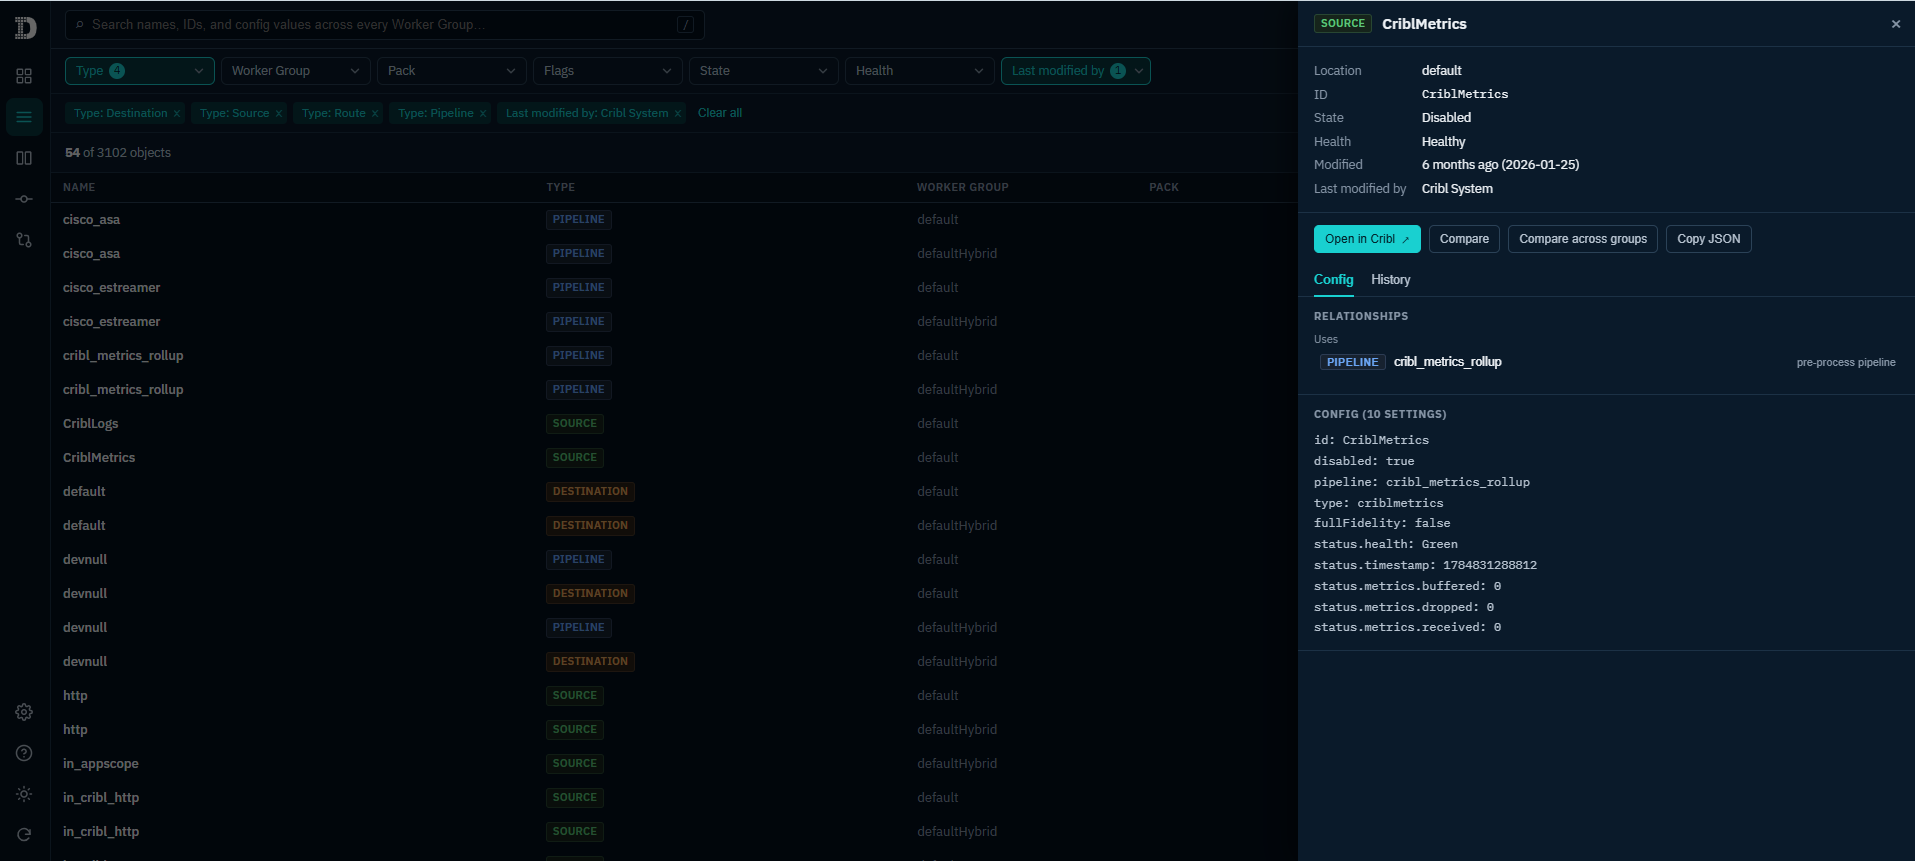
Browse & Filter: Filter by Type, Worker Group, Pack, State, Health, and last modified by – complete with one-click CSV export.
Config Hygiene Findings: Automated flags for unreferenced pipelines, unresolved routes, unused lookups, dead-end sources/destinations, and disabled or stale objects – each assigned customizable severity tiers.
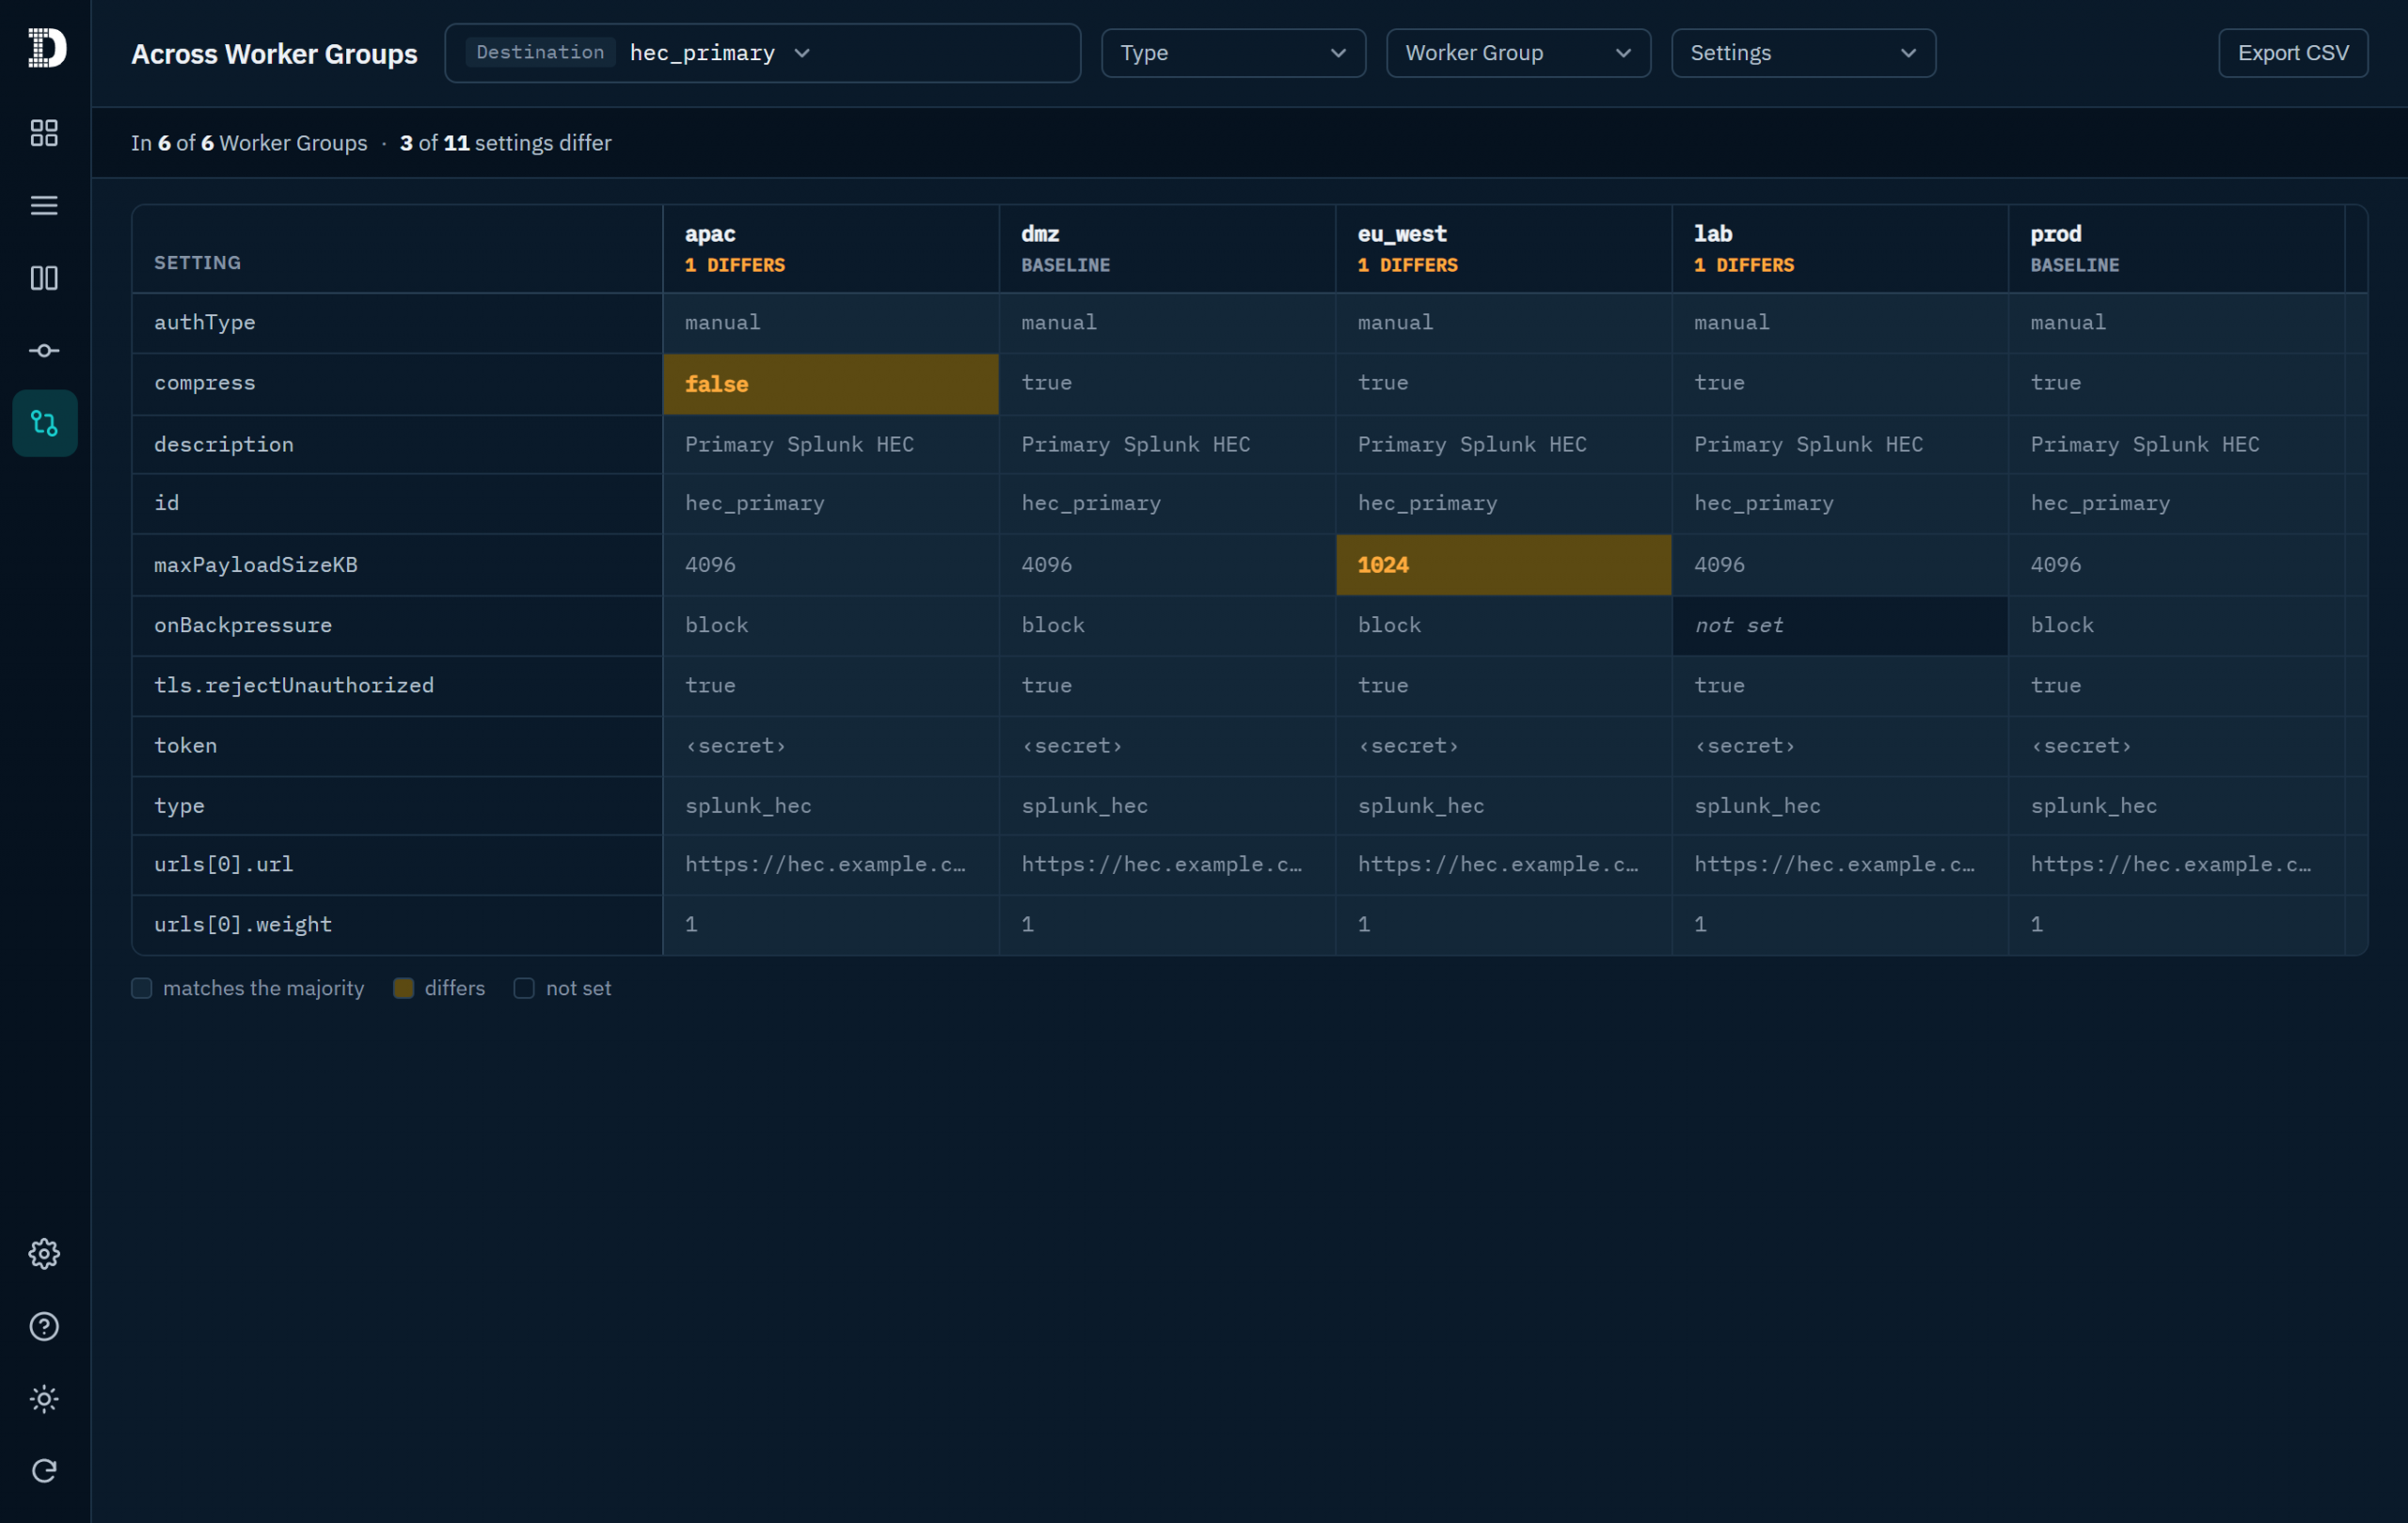
Worker Group Drift Matrix: A dedicated settings × groups comparison matrix that highlights configuration differences across your Worker Groups at a glance.
Side-by-Side Comparison: Compare any two objects of the same type side-by-side to quickly pinpoint setting variances.
Git-Backed Change History: Inspect last-changed dates, commit authors, per-object diffs, and a full commit log browser powered directly by Cribl’s underlying Git versioning.
Deep Linking: Use “Open in Cribl” deep links to jump straight from any object in Config Quest directly into the relevant Leader UI page.
Why Native Cribl Stream Hygiene Matters
When managing complex Cribl Stream environments, getting a true operational picture requires looking at configuration data holistically. By integrating directly into the Cribl App Platform, Config Quest for Cribl solves core configuration challenges natively.
1. Stopping Config Drift Across Worker Groups
As organizations scale, keeping Worker Groups synchronized becomes a constant battle. Config Quest for Cribl’s settings×groups matrix visualizes configuration differences instantly, showing you where settings have drifted between environments so you can fix inconsistencies before they impact data flow.
2. Automated Hygiene & Graph Inspection
Unreachable routes and orphaned pipelines quietly consume operational mental bandwidth. Config Quest for Cribl scans your setup to catch common structural issues before they cause incidents:
Common Hygiene Flags Caught:
Dead-End Sources & Destinations: Active endpoints receiving or expecting data without proper route binding.
Unresolved Routes: Routes that fail to resolve or sit behind catch-all rules.
Unreferenced & Stale Objects: Unused pipelines, dormant lookups, and disabled objects sitting idle in your system.
3. Native Health Telemetry & Deep Integration
Rather than guessing whether an object is operational, Config Quest for Cribl pulls real-time health statuses per object directly from the Leader’s status endpoints. When you spot an anomaly, deep links take you straight to that object in the Leader UI for immediate remediation.
Built for Security: Read-Only by Design
We know that enterprise administrative tools must adhere to strict security posture requirements. Config Quest for Cribl is engineered with a zero-risk footprint:
Strictly Read-Only: All API paths declared in the app’s policies.yml use GET actions. The app cannot modify or delete your Cribl infrastructure.
No External Footprint: Config Quest for Cribl makes zero external API calls and requires no external credentials.
Transparent Permissions: When installing, Cribl displays every declared API path upfront for administrator review.
Overview Dashboard & Getting Started
Getting started with Config Quest for Cribl takes less than a minute. Upon first opening, the app indexes your configuration – a one-time background build that typically completes in under 60 seconds. Subsequent opens load instantly from the cached index, which is shared seamlessly across all authorized users in your organization.
Once indexed, the Overview page gives operators an at-a-glance readout:
Hygiene Summary: Active warnings and critical findings.
Fleet Inventory & Health: Complete object breakdown and telemetry status.
Audit Activity: Recent configuration changes and the latest commit history.
Summary & Next Steps
Proactive Cribl configuration management shouldn’t require manual spreadsheet auditing or clicking through dozens of Worker Group sub-menus. With Config Quest for Cribl, you gain instant full-text search, automated hygiene findings, and full commit history – all within a secure, read-only interface.
Requirements for installation are simple: you need Cribl Stream (with the Cribl App Platform available in your organization) and an Organization Administrator role to install.
Want to clean up your Stream deployment and eliminate config drift?Contact our data observability experts today to learn more or request a walkthrough of Config Quest for Cribl.
Learn more about Config Quest for Cribl by watching the Demo video.
https://discoveredintelligence.com/wp-content/uploads/2026/07/Config-Quest-for-Cribl-Release.png12001200Mihir Meswaniahttps://discoveredintelligence.com/wp-content/uploads/2013/12/DI-Logo1-300x137.pngMihir Meswania2026-08-04 09:19:002026-09-10 16:24:46Introducing Config Quest for Cribl: The All-in-One App for Configuration Visibility and Hygiene
If you’re running Cribl Stream in a distributed environment, you already know the Leader Node is critical, and a Git is non-negotiable for handling config bundling and version control. You’ve probably already discovered how painful it is to experience inconsistencies between development and production, and ultimately, these can lead to unexpected outages, security vulnerabilities, or compliance violations. To avoid this, we like to implement a full GitOps workflow. This way, you apply disciplined CI/CD methods to your configurations, enforcing change control through standard Pull Requests, ensuring everything is auditable, and keeping production rock-solid.
The Foundation: Git Integration in Cribl Stream
For us to implement any truly sophisticated change management within a distributed Cribl environment, Git integration is the absolute essential building block. Since Cribl’s architecture involves a Leader Node coordinating multiple Worker Groups, having centralized version control isn’t just a best practice – it’s mandatory. The Leader Node simply won’t start without it installed in a distributed deployment.
Why Git is Non-Negotiable for Cribl Leaders
Git provides several immediate, built-in benefits essential for managing your dynamic data pipelines:
Audit Trails: Every configuration change is recorded in Git, creating a history of who changed what and when, satisfying crucial security and compliance needs.
Version Comparison and Reversion: It’s an easy way to compare different configuration versions, simplifying the process of identifying and isolating problematic changes, and enabling rapid rollback when necessary.
Configuration Bundling: On a fundamental level, the Cribl Leader uses Git to bundle the finalized configurations, which are then distributed to the Workers in the field.
Beyond Local Commits: Leveraging Remote Git
While a basic deployment just relies on local commits for managing configurations, we find that a true enterprise-grade strategy needs to utilize Remote Git integration, using tools like GitHub or Bitbucket. This remote capability is a robust backup and disaster recovery solution. The key advantage here is redundancy, since the Leader Node holds the main copy of all configurations; its failure could be catastrophic. By simply setting up the Cribl Leader to push its configurations on a schedule to that remote repository, we ensure an off-instance backup. That way, if a primary Leader Node ever goes down, we can always spin up and restore a new Leader directly from the last known-good configuration copy in Remote Git, drastically reducing our recovery time.
Implementing Full GitOps: CI/CD for Data Pipelines
GitOps elevates Git beyond a backup tool; we use it as the single source of truth for my entire data pipeline ecosystem. We believe this model is ideal for organizations that need stringent control, especially those handling complex regulatory requirements or massive volumes of mission-critical data. The core concept is pretty straightforward: it means rigorously separating the development and production environments and strictly governing the flow of all changes between them using standard Git branches and pull requests.
The Two-Environment GitOps Model
In this approach, you maintain two separate Cribl environments, each tied to a dedicated Git branch on the remote repository:
Development Environment: Connected to the dev branch. All initial configuration work – such as building new data Sources, Destinations, or Pipelines – is done here.
Production Environment: Connected to the prod branch. Crucially, the Production Leader is set to a read-only mode. This hard constraint prevents manual, unauthorized changes directly in production, forcing all changes to follow the GitOps pipeline.
The Standard GitOps Workflow
The flow for deploying a new configuration involves a structured, multi-step process:
Development and Commit: You will need to create or modify a configuration (e.g., a new Pipeline) in the Dev Leader. Then use the UI to deploy the changes to the worker and to the remote Git repository’s dev branch.
Pull Request and Review: Create a Pull Request (PR) to merge the changes from the dev branch into the prod branch. This triggers a review by the Cribl Administrator or a designated approver.
Merge and Automation: Once reviewed and approved, the PR is merged, updating the prod branch with the verified configuration. This merge action does not automatically deploy the configuration to the Production Leader.
External Sync Trigger: To apply the changes, an external CI/CD tool (such as Jenkins, GitHub Actions, or a homegrown script) must trigger the Production Leader. You can do this by hitting the Leader’s REST API endpoint /api/v1/version/sync
Deployment to Workers: Once the Production Leader has the new configuration, it automatically distributes the update to its connected Workers.
Handling Environment-Specific Configurations
A key challenge in this two-environment model is that, by default, all development configurations are pushed to production. This isn’t always desirable, and sometimes you need granular control. This is where using environment tags comes into play to manage state:
C.LogStreamEnv Variable: Cribl automatically manages a C. LogStreamEnv variable that identifies whether an instance is DEV or PRD (Production).
Selective Configuration: The environment tag can be used in JavaScript expressions for Sources and Destinations. For example, a Destination defined for production will be enabled in the Prod environment but will appear disabled (“greyed out”) in the Dev environment, offering necessary flexibility while maintaining the core GitOps flow.
Use Case : Updating Lookup Files in GitOps
With enabling GitOps, one interesting use case we have come across is updating a lookup in Cribl via Git. While Cribl provides REST API endpoints for programmatically updating lookups, this customer was interested in using their existing CI/CD process for providing a self-service capability to their users for updating the lookup file. The following steps detail how the update flow looks:
User Update: The user (or an automated script) updates the Lookup File directly within the remote Git repository’s dev branch.
Pull Request and Review: Create a Pull Request (PR) to merge the changes from the dev branch into the prod branch. This triggers a review by the Cribl Administrator or a designated approver.
Merge and Automation: Once reviewed and approved, the PR is merged, updating the prod branch with the verified configuration. This merge action does not automatically deploy the configuration to the Production Leader.
External Sync Trigger: To apply the changes, an external CI/CD tool (such as Jenkins, GitHub Actions, or a homegrown script) must trigger the Production Leader. You can do this by hitting the Leader’s REST API endpoint /api/v1/version/sync
Update DEV leader: Since the lookup update happened directly on the dev branch, the DEV leaders is not aware of the change and we need to do a git pull on the dev leader to keep it up to date with the branch. This again can be part of the external trigger automation
Final Thoughts
Transitioning to a GitOps workflow for Cribl Stream elevates how we manage our data pipelines, moving us away from manual, error-prone changes toward a scalable, auditable, and secure CI/CD process. By embracing Git as the control plane for configuration, we gain the confidence that every single deployment is consistent, every change is traceable, and the production environment is protected by a strong, automated defense against unauthorized modifications. This is more than just an operational improvement; it’s a critical step in building a truly resilient and compliant data observability platform.
Discovered Intelligence Inc., 2025. Unauthorized use and/or duplication of this material without express and written permission from this site’s owner is strictly prohibited. Excerpts and links may be used, provided that full and clear credit is given to Discovered Intelligence, with appropriate and specific direction (i.e. a linked URL) to this original content.
https://discoveredintelligence.com/wp-content/uploads/2025/11/gitops-workflow.png12001200Anoop Ramachandranhttps://discoveredintelligence.com/wp-content/uploads/2013/12/DI-Logo1-300x137.pngAnoop Ramachandran2025-12-02 15:47:302025-12-02 15:48:28Cribl and GitOps: From Development to Production
If your Cribl environment was set up a few years ago, it might be time to revisit some of your settings—particularly the Persistent Queue (PQ) settings on your source inputs. Recently, while troubleshooting an issue, I discovered that the PQ settings were the root cause of the problem. I wanted to share my findings in case they help you optimize your Cribl setup.
https://discoveredintelligence.com/wp-content/uploads/2024/11/persistent_queues.jpg6651000Terry Mulliganhttps://discoveredintelligence.com/wp-content/uploads/2013/12/DI-Logo1-300x137.pngTerry Mulligan2024-12-10 17:08:082024-12-11 18:32:18Beyond Smart: When ‘Always On’ Mode is the Best Choice for Cribl Persisent Queues
Deploying apps to forwarders using the Deployment Server is a pretty commonplace use case and is well documented in Splunk Docs. However, it is possible to take this a step further and use it for distribution of apps to the staging directories of management components like cluster manager or a search head cluster deployer, from where apps can then be pushed out to clustered indexers or search heads.
Splunk Cloud Admins rejoice! The Splunk Cloud ACS Command Line Interface is here! Originally, the Splunk Cloud Admin Config Service (ACS) was released in January 2021 to provide various self-service features for Splunk Cloud Admins. It was released as an API-based service that can be used for configuring IP allow lists, configuring outbound ports, managing HEC tokens, and many more which are all detailed in the Splunk ACS Documentation.
To our excitement Splunk has recently released a CLI version of ACS. The ACS CLI is much easier to use and less error-prone compared to the complex curl commands or Postman setup one has had to deal with to-date. One big advantage we see with the ACS CLI is how it can be used in scripted approach or within a deployment CI/CD pipeline to handle application management and index management.
We would recommend that you first refer to the ACS Compatibility Matrix to understand what features are available to the Classic and Victoria experience Splunk Cloud platforms.
ACS CLI Setup Requirements
Before you get started with the ACS CLI there are a few requirements to be aware of:
You must have the sc_admin role to be able to leverage the ACS CLI.
You must be running a Mac or Linux operating systems. However, if you are a Windows user you can use the Windows Subsystem for Linux (WSL), or any Linux VM running on Windows, to install and use the ACS CLI.
The Splunk Cloud version you are interacting with must be above 8.2.2109 to use the ACS CLI. To use Application Management functions, your Splunk Cloud version must be 8.2.2112 or greater.
Please refer to the Splunk ACS CLI documentation for further information regarding the requirements and the setup process.
ACS CLI Logging
At the time of authoring this blog, logging and auditing of interactions through the Splunk Cloud ACS is not readily available to customers. However, when using the ACS CLI it will create a local log on the system where it is being used. It is recommended that any administrators given access to work with the ACS CLI have the log file listed below collected and forwarded to the their Splunk Cloud stack. This log file can be collected using the Splunk Universal Forwarder, or other mechanism, to create an audit trail of activities.
Linux: $HOME/.acs/logs/acs.log
Mac: $HOME/Library/Logs/acs/acs.log
The acs.log allows an administrator to understand what operations were run, request IDs, status codes and much more. We will keep an eye out for Splunk adding to the logging and auditing functionality not just in the ACS CLI but ACS as a whole and provide a future blog post on the topic when available.
Interacting With The ACS CLI
Below are examples of common interactions an administrator might have with Splunk Cloud now done by leveraging the Splunk Cloud ACS CLI. There are many more self-service features supported by the ACS CLI, details of the supported features and CLI operations are available in the Splunk Cloud ACS CLI documentation.
Application Management
One of the most exciting features of the ACS CLI is the ability to control all aspects of application management. That means, using the ACS CLI you can install both private applications and Splunkbase applications.
The command is easy to understand and straightforward, for both private and Splunkbase applications it supports commands to install, uninstall, describe applications within your environment as well as a list command to return a complete list of all installed applications, with their configurations. Specific to only Splunkbase applications there is an update command which allows you to, you guessed it, update the application to the latest version published and available.
For both private and Splunkbase apps, when running a command it will prompt you to enter your splunk.com credentials. You can pass –username –password parameters along with the command to avoid prompting for credentials. For private apps these credentials will be used to authenticate to AppInspect for application vetting.
Application Management: Installing a Private App
Let’s look at how we use the ACS CLI to install a private application. The following command will install a private app named company_test_app:
acs apps install private --acs-legal-ack Y --app-package /tmp/company_test_app.tgz
Now when a private app is installed using the ACS CLI it will automatically be submitted to AppInspect for vetting. A successful execution of the command will result in the following response, which you will note includes the AppInspect summary:
Submitted app for inspection (requestId='*******-****-****-****-************') Waiting for inspection to finish... processing.. success Vetting completed, summary: { "error": 0, "failure": 0, "skipped": 0, "manual_check": 0, "not_applicable": 56, "warning": 1, "success": 161 } Vetting successful Installing the app... { "appID": "company_test_app", "label": "Company Test App", "name": "company_test_app", "status": "installed", "version": "1.0.0" }
Application Management: Installing a Splunkbase Application
Let’s now look at an example of installing a Splunkbase application by running a command to install the Config Quest application:
The licensing URL passed as a parameter in the command above can be found in the application details on Splunkbase. Additionally, by running a curl command the licensing URL can be retrieved from the Splunkbase API:
Index management using the ACS CLI supports a wide range of functionality. The supported commands allow you to create, update, delete and describe an index within your environment as well as a list command to return a list of all of the existing indexes, with their configurations.
Let’s now look at how we run one of these commands by running a command that creates a metrics index with 90 days searchable retention period. Note that ACS supports creating either event or metrics index, however it does not yet support configuring DDAA or DDSS.
Managing HTTP Event Collector (HEC) token’s just got real easy. The ACS CLI supports commands to create, update, delete and describe a HEC token within your environment as well as a list command to return a list of all of the existing HEC token’s, with their configurations.
Let’s now look at how we run one of these commands by running a command to create a HEC token in Splunk Cloud quickly and easily:
acs hec-token create --name test_token --default-index main --default-source-type test
A successful execution of the command provides the token value in the JSON response:
Planning a sequel to the blog –Moving bits around: Deploying Splunk Apps with Github Actions – led me to an interesting experiment. What if we could manage and automate the deployment server the same way, without having to log on to the server at all. After all, the deployment server is just a bunch of app directories and a serverclass.conf file.
It would be reasonable to argue that no matter the size of the deployment, there aren’t many Splunk deployments out there that have not leveraged the Deployment Server to manage and distribute Splunk apps to other components. Just put everything in the $SPLUNK_HOME/etc/apps/deployment-apps directory of the Deployment Server and create server classes connecting the relevant apps to the appropriate clients that are phoning home. Easy, right? But the big catch with that is this — what if we overwrite a working app with some modifications that may then have to be rolled back, or say, multiple Splunk admins are editing the same configurations or if we accidentally delete one or more apps within the directory and we don’t know which ones. Of course, restoring a full backup of that directory might solve all these problems, provided a full back-up is regularly taken at a short enough interval but this isn’t a great way of managing it in a dynamic environment where there are always changes getting pushed over the apps. It turns out that these are the problems that a version control tool is designed to solve.
Now for most folks, when you hear about version control or source code control, Git is the first and perhaps the only word that comes to mind. And the second word will likely be GitHub which is arguably the most popular source code hosting tool out there that’s based on Git. But is it enough to use Git and Github for version-controlling and hosting Splunk apps for deployment? In a functional sense yes, but not so much from an admin perspective. You must still manage deploying these apps to Splunk Deployment server. This is what could be an example of a “toil” according to Google’s SRE principles. This can and should be eliminated by simply having a CI/CD setup. By the end of 2019, GitHub introduced their own CI/CD setup native to the GitHub platform called GitHub Actions. GitHub Actions is a workflow orchestration and automation tool that can trigger actions based on events such as changes in the GitHub repository. GitHub Actions in our case, can help automate the task of deploying apps to the Deployment Server staging directory.
Automate Splunk App Deployment with GitHub Actions
So we have hosted our Splunk apps in a GitHub repository properly source-controlled. Now let’s explore how we can automate deploying them to the Deployment Server using GitHub Actions.
Note: What this article covers is not a production ready prescriptive solution. The use of GitHub Actions here is solely because of the relatively simple one-stop-shop approach in realizing the benefits of version-controlled hosting as well as continuous deployment of Splunk apps.
The setup consists of three parts – the source (GitHub Repository), the intermediary (runner) and the destination (Deployment Server). GitHub Actions invokes a runner instance as an intermediary to run the actions from. This instance is what will connect to the target server. This can either be a self-hosted runner that you must provision in your infrastructure or a GitHub-hosted runner.
Let me highlight a couple of important factors at play in choosing the runner instance type.
1. Security Considerations
Hosting self-hosted runners or using GitHub-hosted runners have some common as well as unique security implications. While network connectivity requirements are unique to each approach, SSH authentication is common to both. You may either not want to allow external connections directly to Deployment Server or you may be having a public repository. GitHub recommends that you only use self-hosted runners with private repositories. This is because forks of your repository can potentially run dangerous code on your self-hosted runner machine by creating a pull request that executes the code in a workflow. This is not an issue with GitHub-hosted runners because each GitHub-hosted runner is always a clean isolated virtual machine, and it is destroyed at the end of the job execution.
2. Usage limits and Billing
Usage limits are primarily based on storage and free minutes. Self-hosted runners are free to use but come with some usage limits. For GitHub-hosted runners, different usage limits apply.
I have linked the documentation in the appendix for further reading on this topic.
For demonstration purposes, I am going to use a self-hosted runner.
Destination:
Let’s configure the destination first which is the Deployment Server.
On a high level, the steps involve
Creating an SSH key-pair
Creating a user specific for the task in the Deployment Server
Making the Deployment Server accessible using the above created SSH key-pair for the created user
Setting proper permissions on the target staging directory
First off, we create an SSH key locally like so:
ssh-keygen -t ed25519 -C "your_email@example.com"
Enter the file name to save the keys and leave the passphrase field empty.
Then we login to the Deployment Server and create a user, say, ghuser, in there.
Make the host accessible for the user over SSH by adding the above created public key to the /home/ghuser/.ssh/authorized_keys. I have linked a page in the appendix that covers step-by-step instructions on how to do this in a Linux instance.
Next, we need to give this user full access to $SPLUNK_HOME/etc/deployment-apps directory. For instance, if Splunk is installed under /opt, then:
Now, if Splunk is run as a non-root user, commonly named as splunk, then that user can be leveraged for this purpose in which case you do not need to grant any additional directory permissions as above.
Once this is completed, we now have a user that can SSH to the deployment server and modify the deployment-apps directory. We will be using this user in our GitHub Actions.
Intermediary:
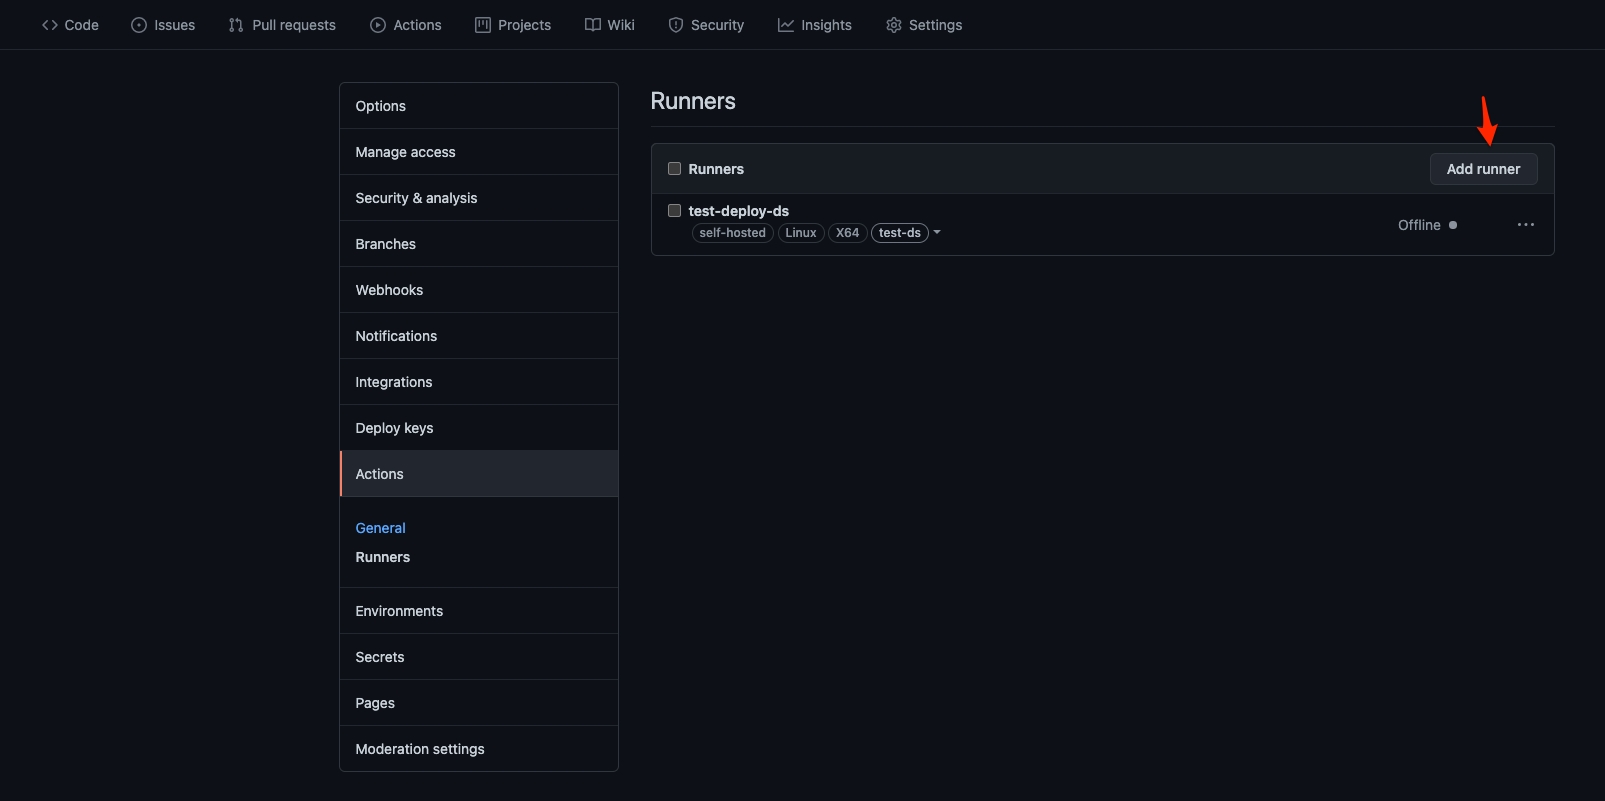
Once the runner instance is provisioned , we need to install the client application on the host to poll the repository. Go to Settings -> Actions -> Runners in the GitHub Repository.
When you click on the Add runner button as shown above and select the OS and CPU arch, you are presented with the instruction to set up the client application. Now for the client application to successfully do HTTPS long polls to the GitHub repository, you must ensure that the host has the appropriate network access to communicate with specific GitHub URLs. Appendix has a link that points to those URLs.
Next the self-hosted runner needs to be set up with Docker for the specific GitHub Action that we are going to set up in the next step. This is also straightforward. Here I am using an Amazon Linux 2 EC2 instance and here are the installation steps for that:
Update your system $ sudo yum update -y
Install Docker $ sudo yum install docker -y
Start Docker $ sudo service docker start
Add your user to the docker group $ sudo usermod -a -G docker USERNAME
Log out and log back in.
Verify Docker runs without sudo $ docker run hello-world
I have linked a document in Appendix that covers Docker installation on different Linux flavors.
Source:
GitHub Actions has a marketplace where we can look for off-the-shelf solutions which in our case is to push the apps out from the repository to the deployment server. In this example, I have used two workflows; 1) checkout that is a standard GitHub-provided Action to check out the repository and 2) rsync-deployments that essentially spins up a docker container in the runner to rsync the specified directory from the checked-out repository to the destination directory in the target host.
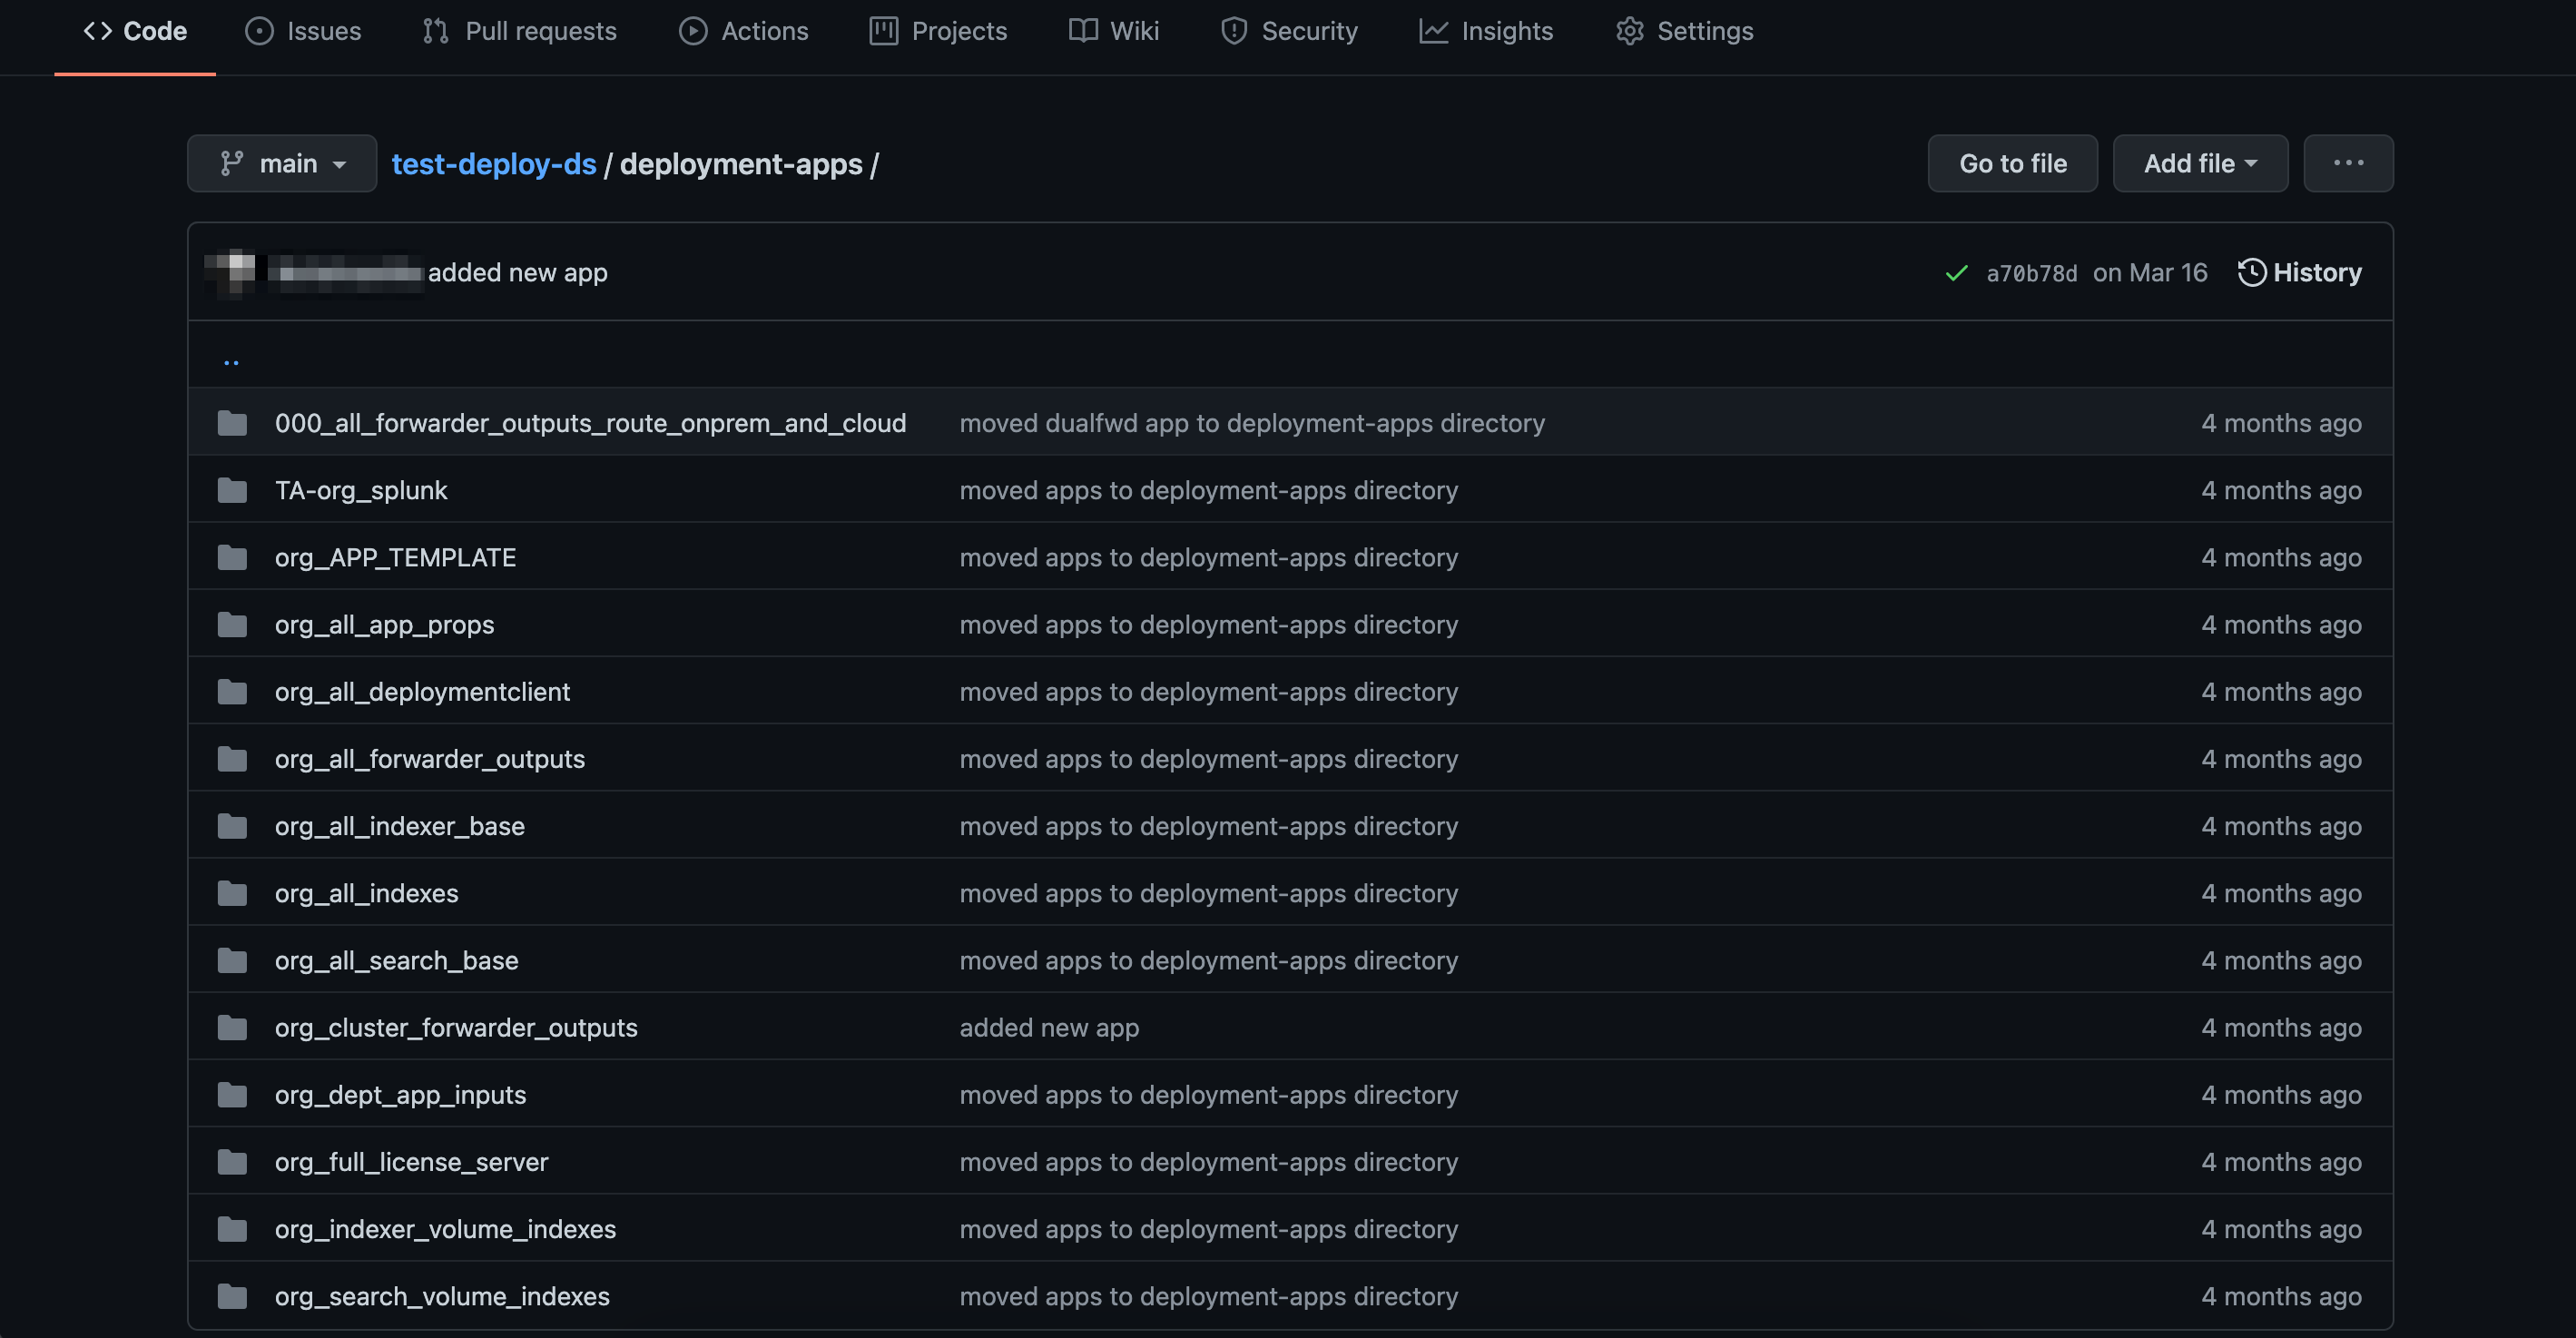
First, we create a repository with a sub-directory that contains all the Splunk apps to be copied to the deployment server’s deployment-apps directory. In this example the repository I have used is test-deploy-ds and all the Splunk apps reside within a subdirectory that I have named as deployment-apps to match with the target directory, but this can be any name you want. See below:
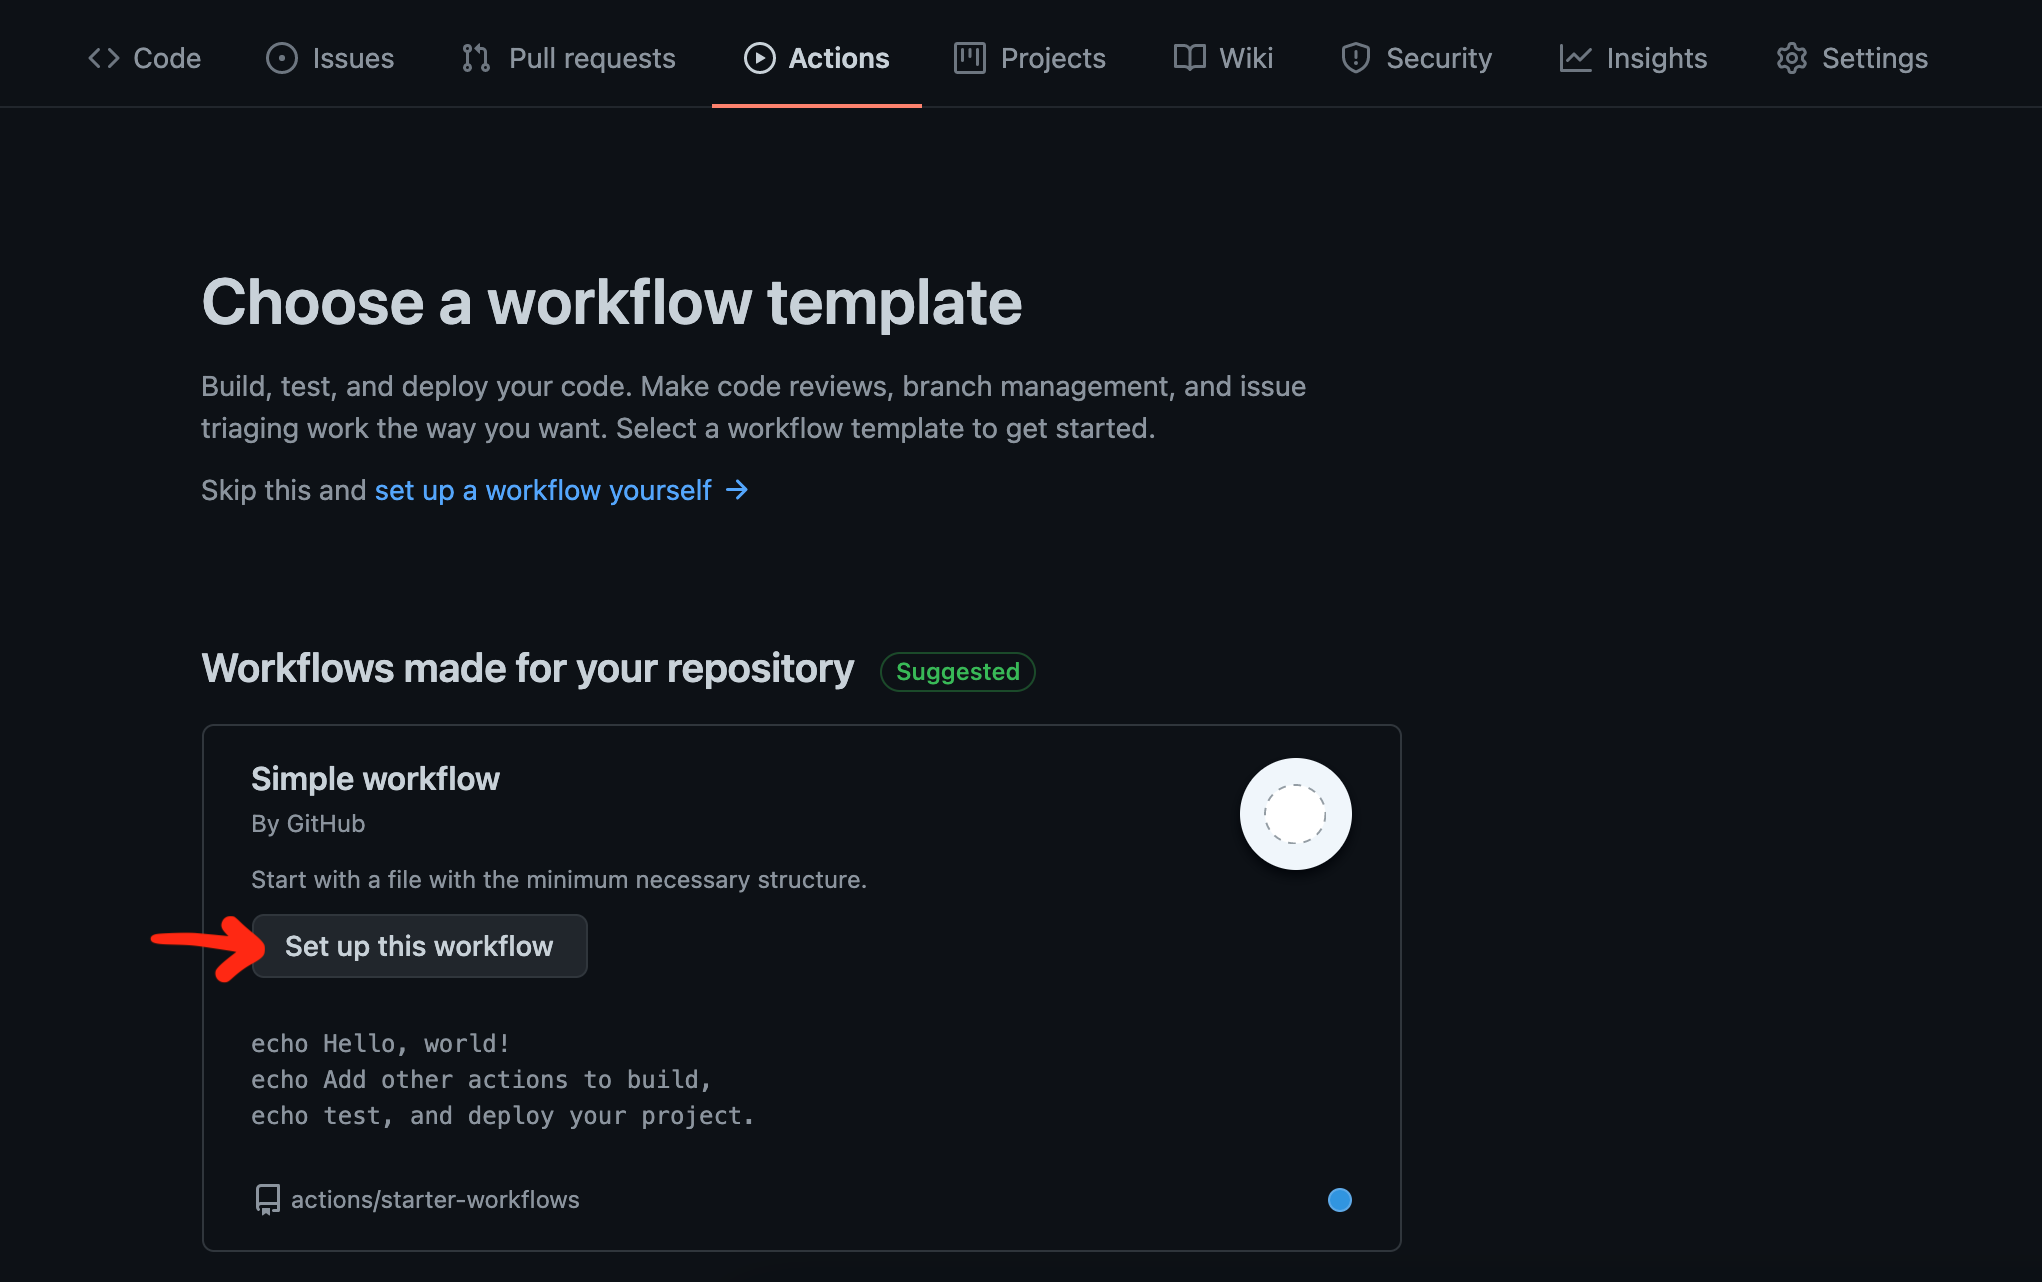
Then we create a simple workflow from the Actions tab of the repository like so:
Name the yml file that opens in the next screen suitably like push2ds.yml or so.
Modify the file as below.
# This is a basic workflow to help you get started with Actions

name: CI

# Controls when the action will run.
on:
  # Triggers the workflow on push or pull request events but only for the main branch
  push:
    branches: [ main ]

  # Allows you to run this workflow manually from the Actions tab
  workflow_dispatch:

# A workflow run is made up of one or more jobs that can run sequentially or in parallel
jobs:
  # This workflow contains a single job called "build"
  build:
    # The type of runner that the job will run on
    runs-on: self-hosted

    # Steps represent a sequence of tasks that will be executed as part of the job
    steps:
      # Checks-out your repository under $GITHUB_WORKSPACE, so your job can access it
      - uses: actions/checkout@v2

      # Runs the Rsync Deployment action
      - name: Rsync Deployments Action
        uses: Burnett01/rsync-deployments@4.1
        with:
          switches: -avzr --delete --omit-dir-times --no-perms --no-owner
          path: deployment-apps/
          remote_path: /opt/splunk/etc/deployment-apps
          remote_host: ${{ secrets.DEPLOY_HOST }}
          remote_user: ${{ secrets.DEPLOY_USER }}
          remote_key: ${{ secrets.DEPLOY_KEY }}
Explanation:
1) This workflow is triggered upon a push to main branch
2) The build specifies the job that will be run on a self-hosted runner
3) The steps in the build job includes checking out the repository using the checkout action followed by the rsync execution using the rsync-deployments action
Lets dissect the rsync-deployments action as this is the custom code I had to write for the use case:
the name attribute is a briefly descriptive name of what the Action does
the uses attribute then includes the marketplace action rsync-deployments to be referenced
the with attribute has several attributes inside as below
switches attribute has the parameters required to be passed with the rysnc command. Check out the link in the appendix for what each of them does.
path represents the source directory name within the repository which in this case has been named as deployment-apps
remote_path is the deployment server $SPLUNK_HOME/etc/deployment-apps directory
remote_host is the deployment server public IP or hostname
remote_user is the username we created in the deployment server that is ghuser
remote_key is the SSH private key created earlier to be used to authenticate into the deployment server
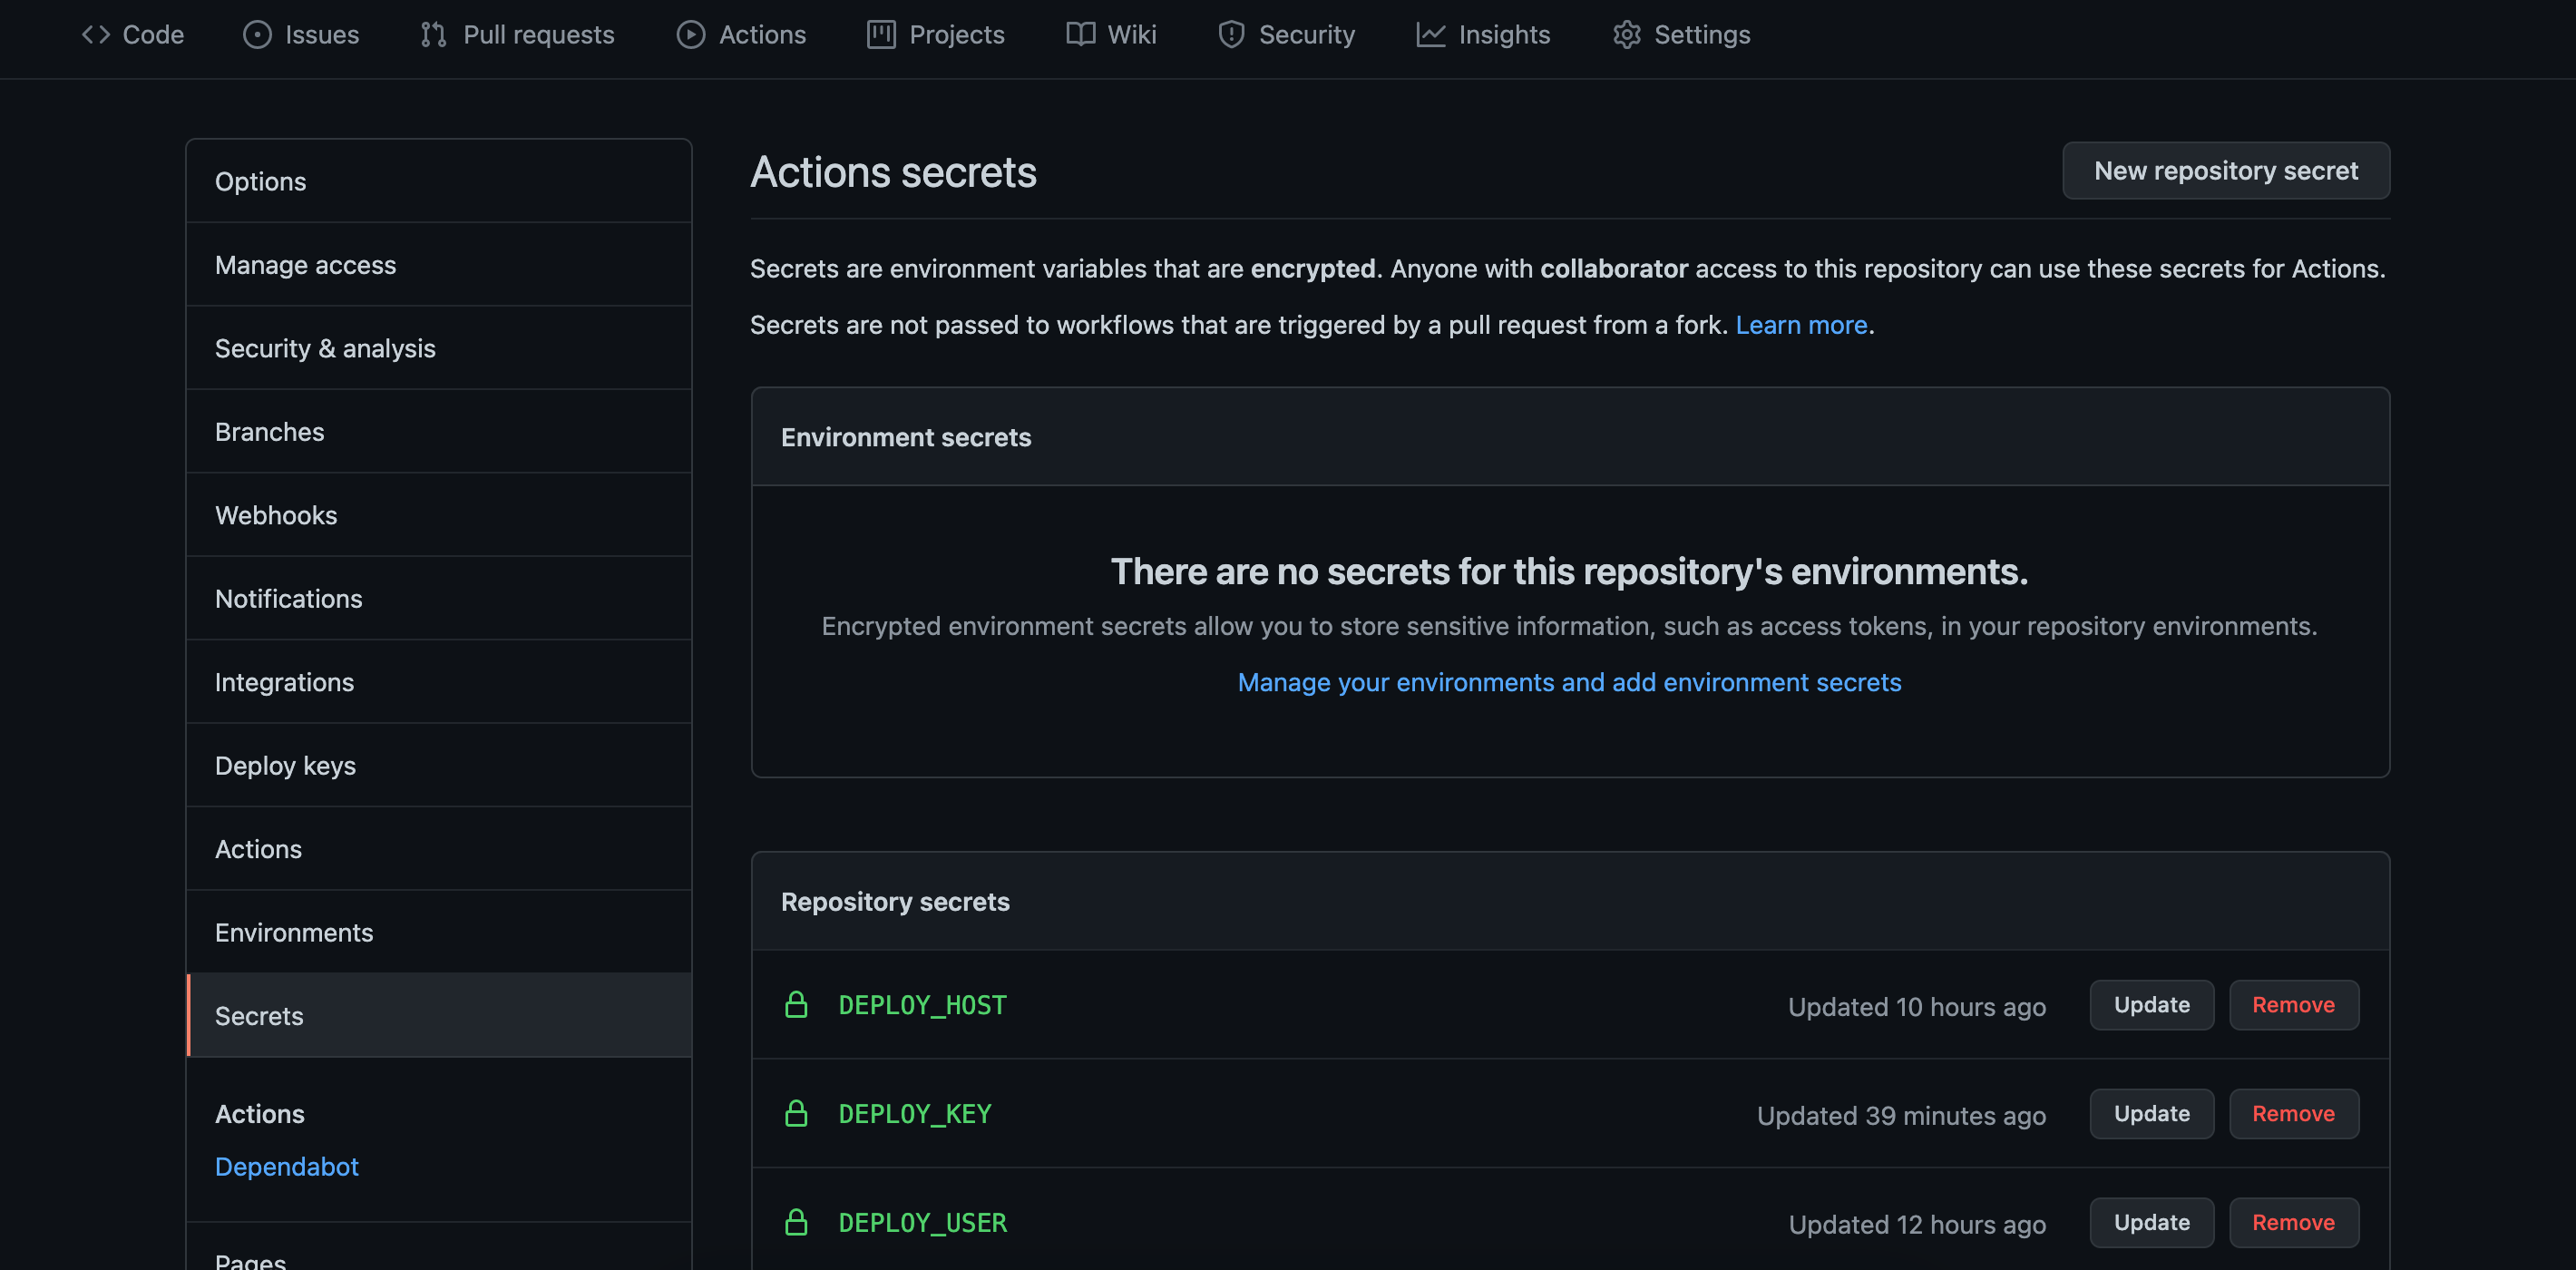
Note the use of GitHub Secrets in the last few attributes. This is a simple yet secure way to storing and accessing sensitive data that is susceptible to misuse by a threat actor. Below image shows where to set them.
PS: remote_port is an accepted attribute that has been skipped here as it defaults to 22. You can choose to specify a port number if default port 22 is not used for SSH.
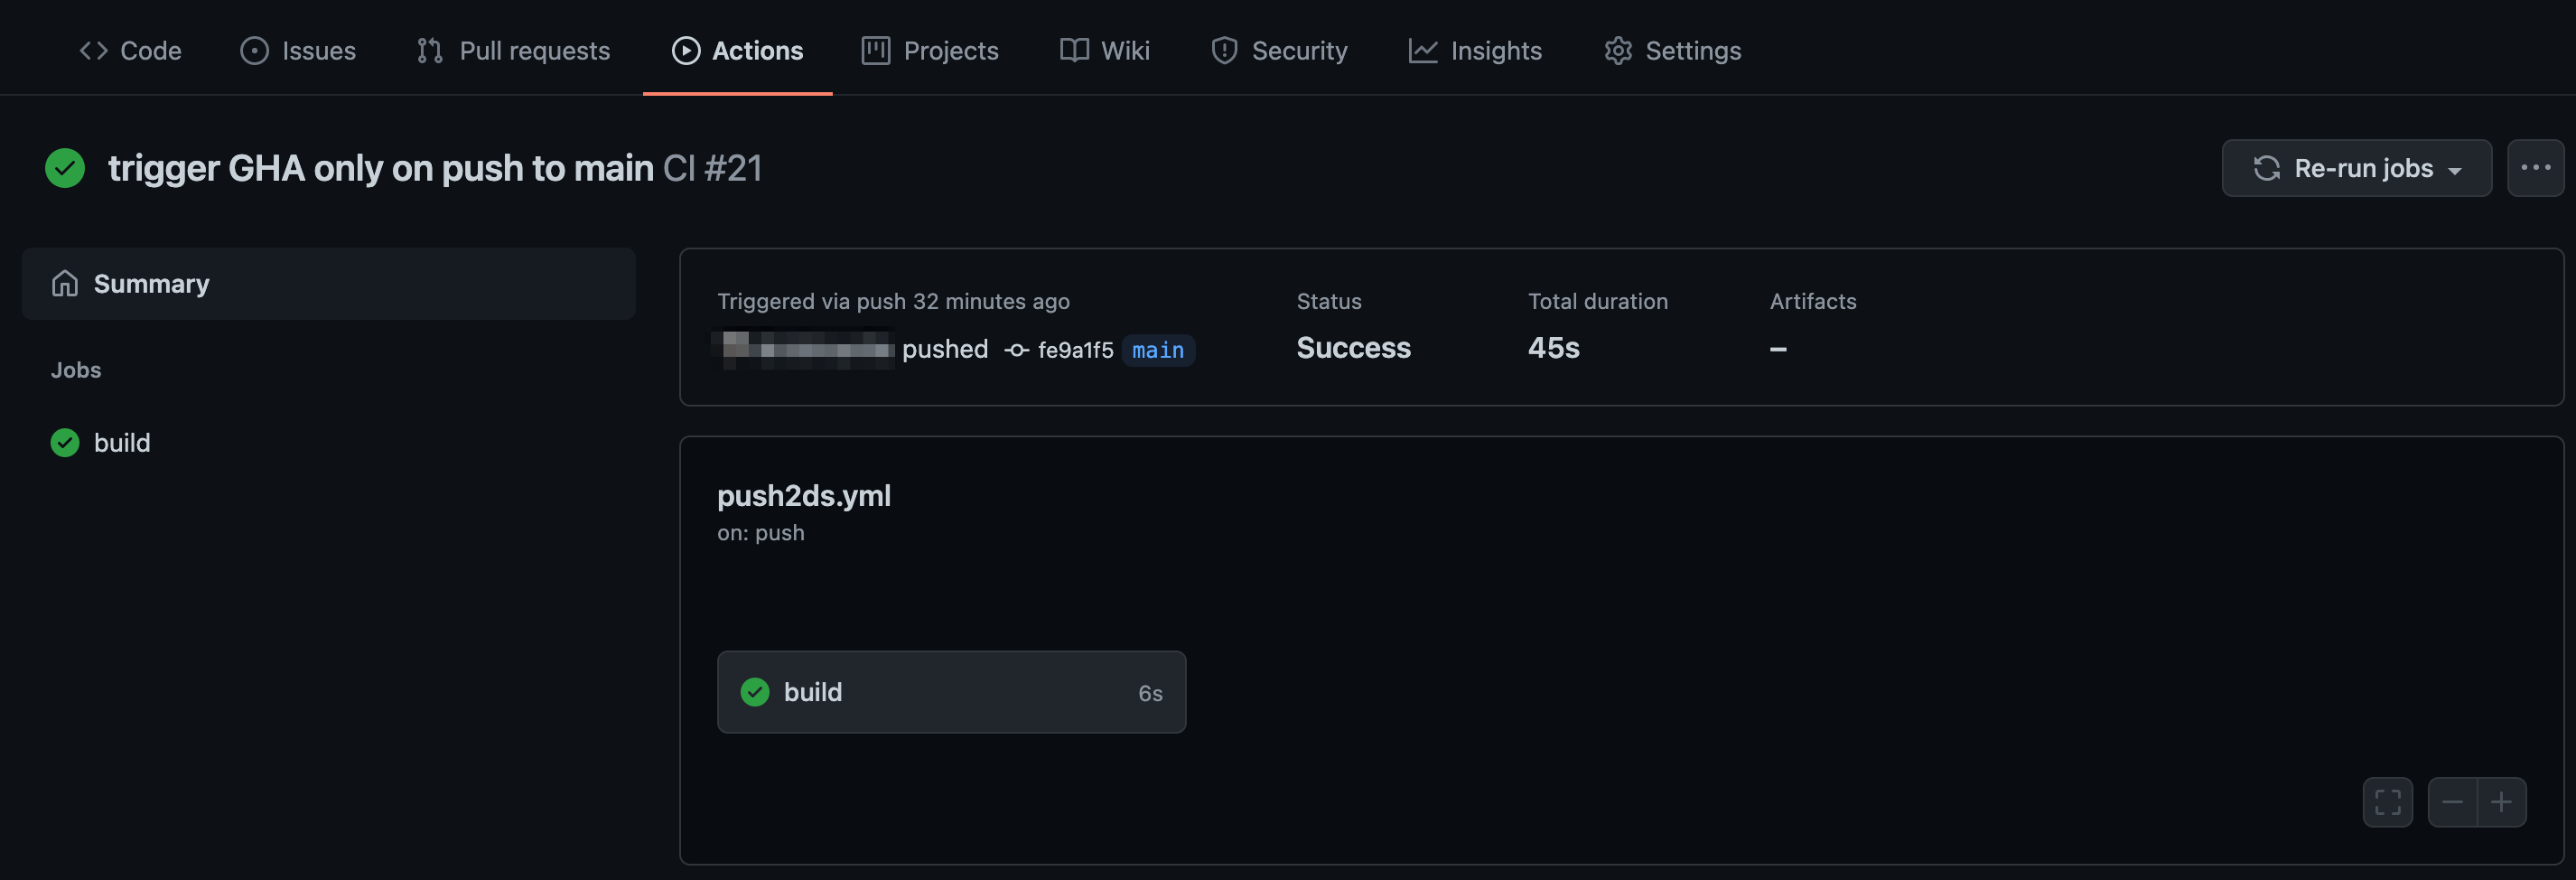
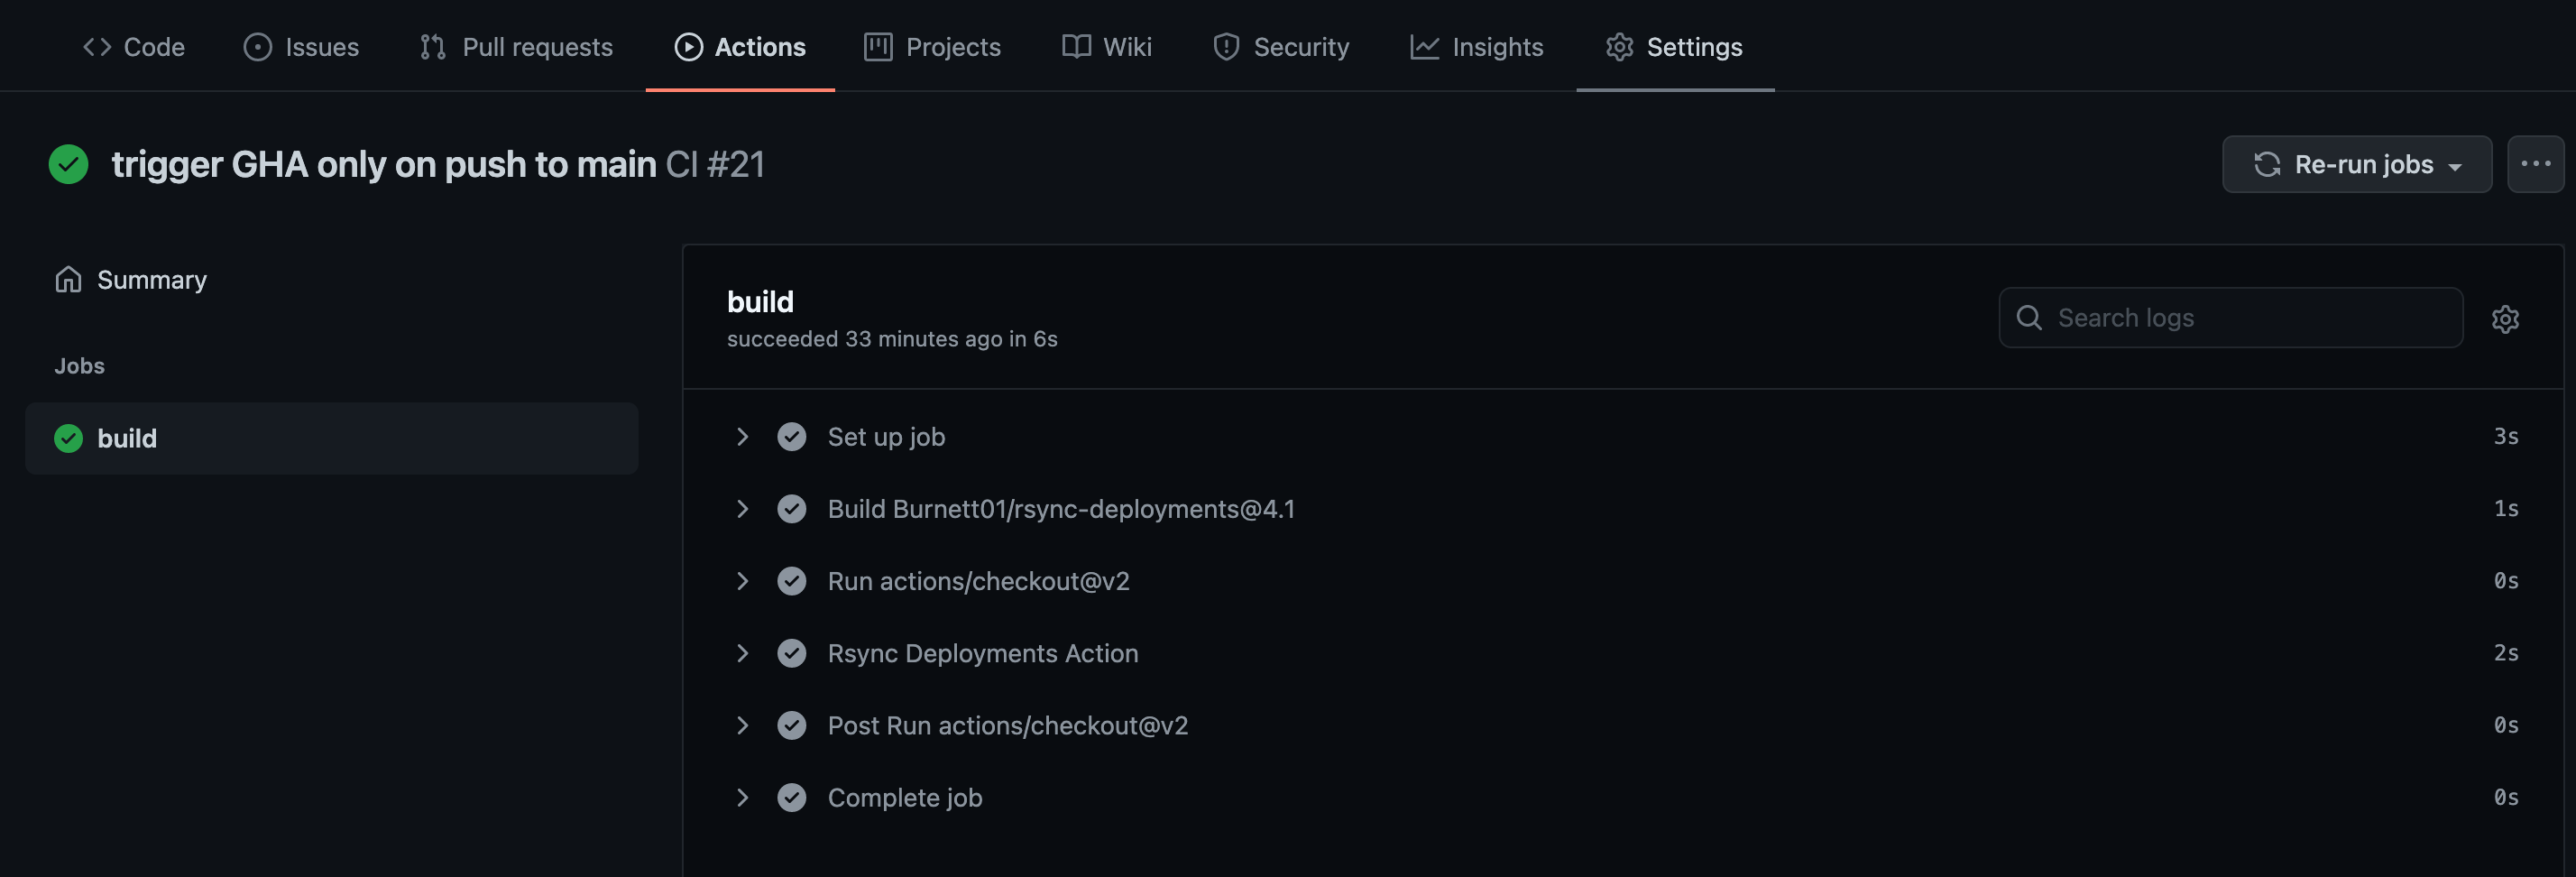
As soon as the above yml file is committed or a new app is committed, the workflow job kicks off. The job status can be verified as seen in the below images.
Go to Actions tab:
Click on the latest run Workflow at the top – here ‘trigger GHA only on push to main’ which is the commit message:
Click on the job – build. You can expand all steps in the build job to look for detailed execution of that step. The build status page also highlights any failed step in red. Expand that step to check failure reasons.
Once it is verified that the job has successfully completed, we can login to the deployment server and confirm that the Splunk apps are pushed to the $SPLUNK_HOME/etc/deployment-apps directory.
$ ls -lart /opt/splunk/etc/deployment-apps/
total 8
drwxr-xr-x  16 splunk splunk 4096 Jun 24 18:11 ..
drwxrwxr-x   4 ghuser ghuser   35 Jun 29 05:00 TA-org_splunk
drwxrwxr-x   4 ghuser ghuser   35 Jun 29 05:00 org_APP_TEMPLATE
drwxrwxr-x   4 ghuser ghuser   35 Jun 29 05:00 org_all_indexer_base
drwxrwxr-x   4 ghuser ghuser   35 Jun 29 05:00 org_all_forwarder_outputs
drwxrwxr-x   4 ghuser ghuser   35 Jun 29 05:00 org_all_deploymentclient
drwxrwxr-x   4 ghuser ghuser   35 Jun 29 05:00 org_all_app_props
drwxrwxr-x   4 ghuser ghuser   35 Jun 29 05:00 org_search_volume_indexes
drwxrwxr-x   4 ghuser ghuser   35 Jun 29 05:00 org_indexer_volume_indexes
drwxrwxr-x   4 ghuser ghuser   35 Jun 29 05:00 org_full_license_server
drwxrwxr-x   4 ghuser ghuser   35 Jun 29 05:00 org_dept_app_inputs
drwxrwxr-x   4 ghuser ghuser   35 Jun 29 05:00 org_cluster_forwarder_outputs
drwxrwxr-x   4 ghuser ghuser   35 Jun 29 05:00 org_all_search_base
drwxrwxr-x   4 ghuser ghuser   35 Jun 29 05:00 org_all_indexes
drwxrwxr-x+ 16 splunk splunk 4096 Jun 29 05:00 .
drwxrwxr-x   3 ghuser ghuser   37 Jun 29 15:21 000_all_forwarder_outputs_route_onprem_and_cloud
A word of caution though, if we are pushing the apps using a user other than splunk that owns $SPLUNK_HOME, then such apps when pushed to the deployment clients will not preserve the ownership or permissions, instead, will have a permission mode of 700. Let’s look at how one of these apps org_APP_TEMPLATE will appear at a target forwarder of a serverclass.
$ ls -lart /opt/splunkforwarder/etc/apps/ | grep org
drwx------  4 splunk splunk   35 Jun 29 18:37 org_APP_TEMPLATE
Now if you’re wondering – wait, do I need to provision an extra server? – be aware that there is also the option of using a GitHub-hosted runner. This needs an update in the push2ds.yml’s runs-on: attribute; for e.g. If you want to simply have a Linux-flavored host as the intermediary, just update the attribute like so – runs-on: ubuntu-latest . But keep in mind that this will require opening the SSH port of the deployment server to external IPs as well as some cost implications.
Conclusion
In this article we touched upon the benefits ofversion control for Splunk apps managed and distributed via a Deployment Server. Then we explored a simple practical approach to this using GitHub Actions and the main considerations if we’re going down this path. We then proceeded to apply it in a practical use case. If you are not using GitHub in your organization, depending on your CI/CD pipeline, you could possibly re-engineer the solution to fit for purpose. If you found this useful, please watch this space for a sequel about how this opens up further possibilities in end-to-end Splunk apps management in a distributed clustered deployment.