Building a Unified View: Integrating Google Cloud Platform Events with Splunk
By: Carlos Moreno Buitrago and Anoop Ramachandran
In this blog we will talk about the processes and the options we have to collect the GCP events and we will see how to collect those in Splunk. In addition, we will even add integration with Cribl, as an optional step, in order to facilitate and optimize the process of information ingestion. After synthesizing all of this great information, you will have a great understanding of the available options to take, depending on the conditions of the project or team in which you work.
The Clouds are Growing…
Platform as a service (PaaS), infrastructure as a service (IaaS), Software as a service (SaaS), and Container as a service (CaaS) are innovative solutions that are increasingly present in more companies worldwide and have more market share. Moreover, according to Statista, “In Q1 2023, global cloud infrastructure service spending grew by more than $10 billion compared to Q1 2022, bringing total spending to $63.7 billion for the first three months of this year”. If this trend continues, we will reach over $200 billion this year and over 65% of that is shared between Amazon Web Services (AWS), Microsoft Azure and Google Cloud Platform (GCP).
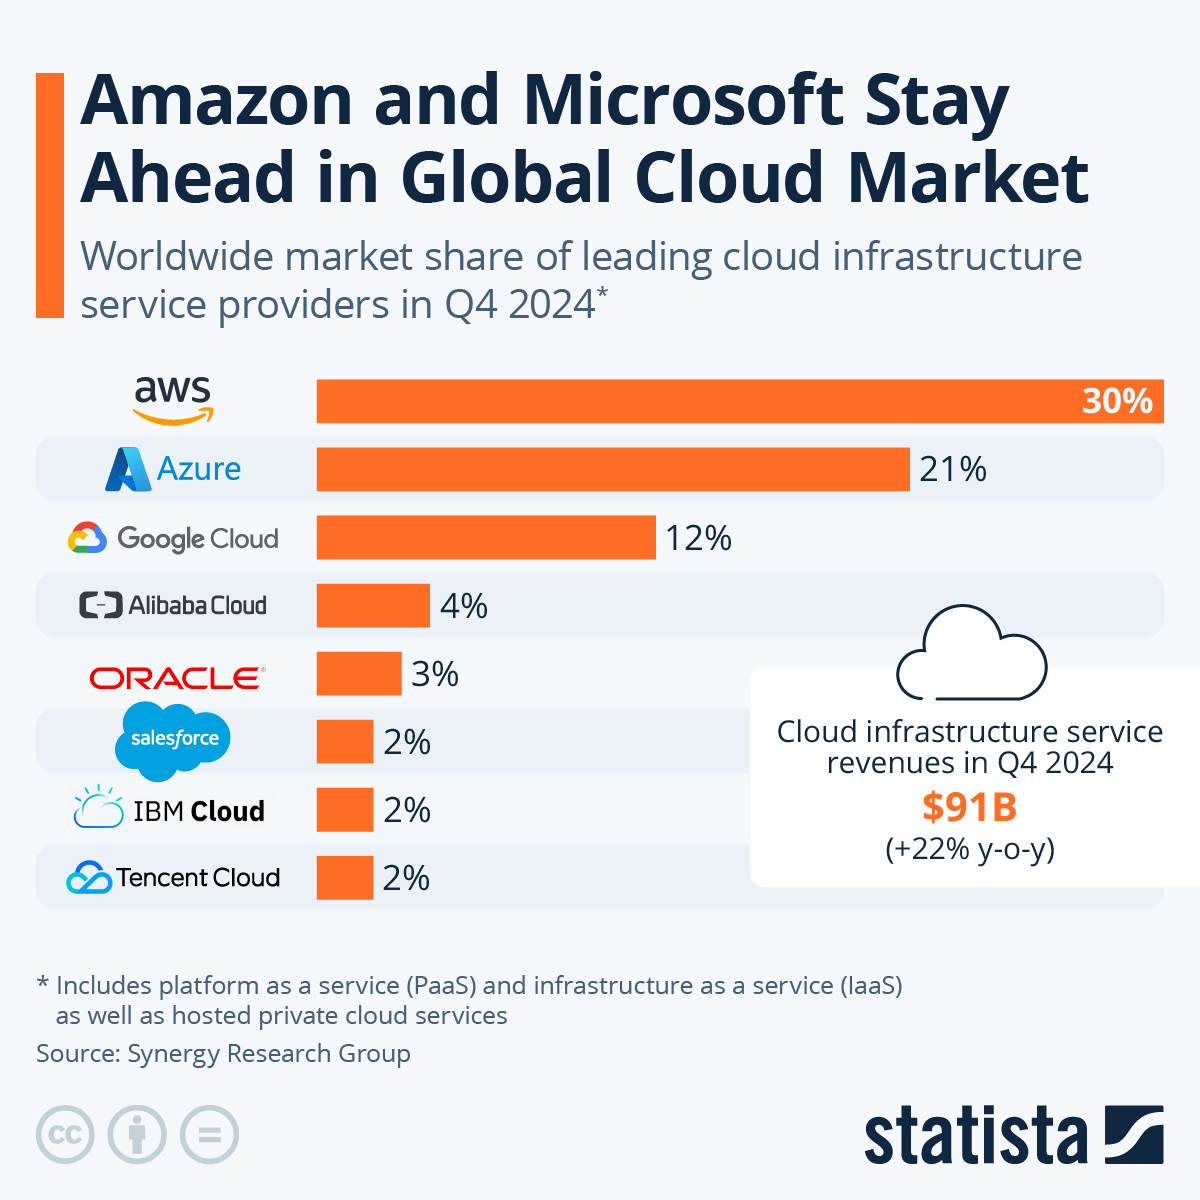
Source: Statista
Although GCP will be the third within the top Cloud providers, in the last few months we have had an increase related to customers who have GCP and want to integrate multiple events into their Splunk Cloud Platforms. We are not surprised, as companies like UPS (the largest logistics company) and social media giant Twitter already rely on GCP.
Exploring the Google Cloud Platform
Today we will answer questions such as: Where are the events in GCP? Do we have metrics? What services can we use to manage and export the events? Do we have only one option or multiple? After reading this post, you will be able to quickly identify what information you have in GCP and the way to export it.
The first step is to identify the GCP resource hierarchy:
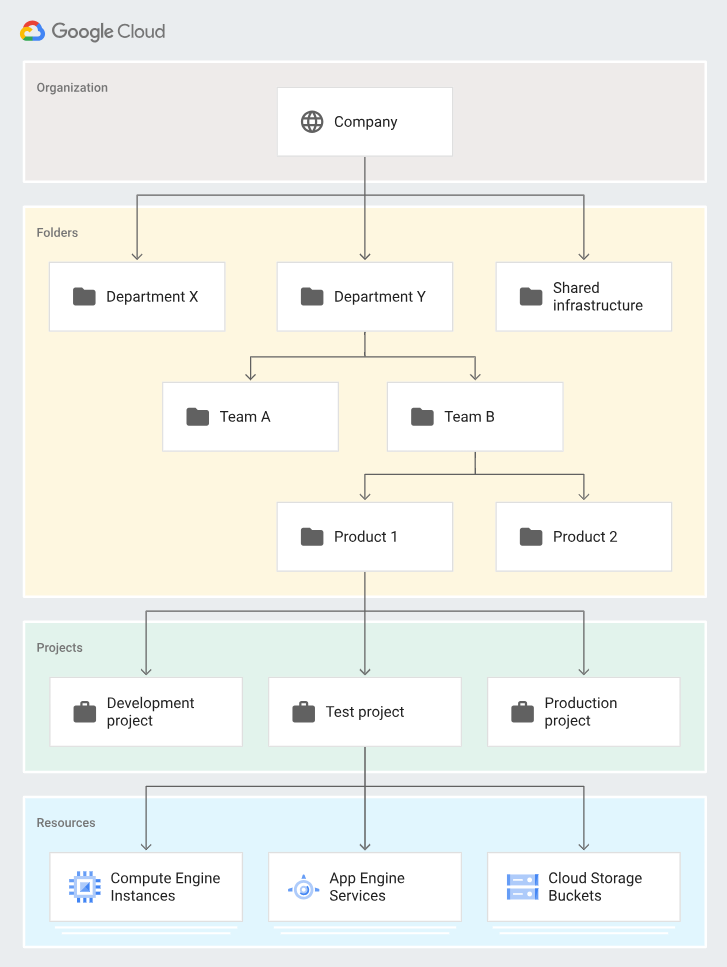
All resources, except for the highest resource, in a hierarchy have exactly one parent. At the lowest level, service resources are the fundamental components that make up all Google Cloud services. Examples of service resources include Compute Engine Virtual Machines (VMs), Cloud Storage buckets, Virtual Private Cloud, Pub/Sub topics, App Engine instances, etc. All these lower level resources have project resources as their parents, which represent the first grouping mechanism of the Google Cloud resource hierarchy. So this is an important concept because each project has different Cloud services and different logs.
Once we understand the hierarchy, it is time to determine the services. Google Cloud Platform provides a wide range of services to create virtual machines, buckets, data bases, machine learning models, among others, so we will use few of them to complete this blog post. If you are interested in all the GCP services, you will find them with accurate descriptions, examples, guides and courses in the Google Cloud Developer Cheat Sheet.
Services to use in the project:
- Identities and roles to create a service account.
- Compute Engine to manage the “discoveredintelligence-host1” Virtual Machine, which generates events.
- Logs Explorer to check the GCP events.
- Log router sink to route the logs to the pub/sub.
- Monitoring to check the Virtual Machine metrics.
- Pub/Sub to store and consum the events.
- Dataflow to push the events to Splunk.
Ok, Let’s play!
As mentioned above, we have a virtual machine running which generates events like VM created, stopped, started, key exchange, etc, so you can check those in the Logs Explorer service with the following filter:


Logs Explorer is one of the most important services in GCP because you can use it to retrieve, view, and analyze log data, and troubleshoot problems. Our goal is to send those logs to Splunk using 3 methods: Pull, push and Cribl.
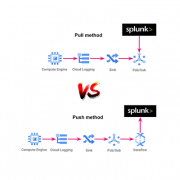
- Pull method: Get the events from GCP using API calls and store them in Splunk. The Splunk Add-on for Google Cloud Platform will help us.
- Push method: Get the events from GCP using its services and send them to Splunk. The dataflow service will help us to manage the send process.

Pull method
Here is a summary of the steps to follow:
- Have the Splunk Add-on for Google Cloud Platform installed in your Heavy Forwarder, IDM or Search Head in Victoria experience.
- Create a GCP service account and the key in JSON format.
- Create a Pub/Sub topic.
- Create a Log router sink.
- Configure the Splunk side.
The virtual machine is generating logs, so we will redirect them from the Logs explorer service to the Pub/Sub topic using a log router sink. Once the events are in the Pub/Sub service, the Splunk Add-on for GCP can execute the API requests to read the Pub/Sub subscription and get the GCP events.
The Splunk Add-on for GCP is a really good option if you are starting your journey in GCP, because it does not require more costs nor extra configuration. However there are some limitations:
- Ingesting Google Cloud asset inventory data, or for storage buckets, the JSON files must be smaller than 250MB.
- Depending on the hardware and workload, some tests were performed and concluded 1 subscription with 1 input can get 1800 KB/s (~155GB/day), but this result is not linear, and gradual degradation was observed once the number of subscriptions and inputs increased. For example, 200 subscriptions with 16 inputs for each one can get 16320KB/s (~1340GB/day, and note the volume of subscriptions and inputs to be maintained).
Push method
Here is a summary of the steps to follow:
- Have an HTTP Event Collector created in your Heavy Forwarder or Splunk Cloud.
- Create a Pub/Sub topic.
- Create a Log router sink.
- Create a Dataflow service.

We keep the first part of the environment test so the Pub/Sub topic is receiving the logs from the virtual machine, but now we do not need a service account nor the Splunk Add-on for GCP. We will use the Dataflow service, which is a unified stream and batch data processing that’s serverless, fast, and cost-effective, therefore the following advantages are highlighted:
- Managed service: The Dataflow service manages the required resources in Google Cloud for data processing tasks.
- Distributed workload: The workload is distributed over multiple workers for parallel processing. Unlike when pushing data to a Splunk heavy forwarder, there’s no single point of failure.
- Security: Data is pushed to Splunk HEC, so there’s none of the maintenance and security associated with creating and managing service account keys.
- Autoscaling: The Dataflow service autoscales the number of workers in response to variations in incoming log volume and backlog.
- Fault-tolerance: Retries to Splunk HEC are handled automatically if there are network issues.
- Centralized: You avoid management overhead and the cost of running one or more Splunk heavy forwarders.
In contrast to the Splunk Add-on for GCP, the Dataflow service presents numerous advantages to users dealing with substantial data volumes, seeking to centralize event management within GCP, or requiring near real-time data availability.
Using Cribl
If you are already using Cribl in your organization you can use that for collecting data from GCP. Cribl has ‘Google Cloud Pub/Sub’ source available for collecting data from Google Cloud Pub/Sub service.
For those who are not familiar with Cribl, read though this overview to get an understanding of how Cribl can add value to your organization.
Summary of the steps to follow:
- Create a GCP service account and the key in JSON format.
- Create a Pub/Sub topic.
- Create a Log router sink.
- Configure ‘Google Cloud Pub/Sub’ source in Cribl
The detailed steps for GCP configuration is provided in the Splunk Conf session as listed towards the bottom of this document . You can also review the steps for configuring Cribl source.
A few things to consider while configuring ‘Google Cloud Pub/Sub’ source in Cribl:
- The topic/subscriber ID is the name you have provided at the time of creating the topic and subscription. Cribl does not require the whole path of the pub/sub ID
- Review the Advanced Settings in the source configuration incase you need to update Max backlog, Request timeout settings.
Configuring GCP data collection using Cribl is easy and straightforward. After creating the data collection using Cribl source, you can configure Cribl pipelines to filter, reduce and enrich the data. Configure Cribl Routes to send this data to one or many destinations supported by Cribl.
Looking for more information?
Take your next step by putting all the content to the test. If you require further details, look in our session from Splunk .conf23, “PLA1929C – From Cloudy to Clear: The Integration Story of Google Cloud Platform™ on Splunk® Cloud Platform” where we delve into the comprehensive process of integrating GCP events into Splunk using both pull and push methods. Within this session, you’ll discover two instructive demos, guiding you through each step of the process, ensuring a seamless and triumphant integration of events into Splunk. And remember, our team is always at your disposal to help you achieve your goals. Don’t hesitate to reach out and leverage our expertise to maximize your success!
© Discovered Intelligence Inc., 2023. Unauthorised use and/or duplication of this material without express and written permission from this site’s owner is strictly prohibited. Excerpts and links may be used, provided that full and clear credit is given to Discovered Intelligence, with appropriate and specific direction (i.e. a linked URL) to this original content.
Except as otherwise noted, the images with a Source of Google are licensed under the Creative Commons Attribution 4.0 License.

