
Managing distributed data pipelines can quickly feel like searching for a needle in a haystack. That’s why we recently launched Config Quest for Cribl. It’s a lightweight, read-only app designed to give you instant, cross-group context. Check out our demo to see how it works.
Video Summary:
Spot Bad Hygiene Instantly: In the Overview dashboard, you will see how the app automatically surfaces critical environment issues like stranded sources, unreached destinations, and unreferenced pipelines.
Deep, Regex-Powered Searching: If you only have a port number or a fragment of a hostname, we demonstrate how to search the values inside your configurations, then use the auto-generated relationships graph to see exactly what feeds into a specific pipeline.
Configuration Drift: The Compare and Differences tabs to matrix an object (like a hec_primary destination) across multiple Worker Groups, instantly highlighting drift.
Tracking Git History Without Leaving the UI: See how you can identify who changed the web logs pipeline, and when. The Commits tab shows how Config Quest pulls the Leader’s Git history directly into your workflow so you can pinpoint the exact commit that caused an issue.
We built Config Quest to bring much-needed context to the DevOps and security teams doing the heavy lifting in Cribl every day. It doesn’t write, it doesn’t deploy; it strictly gives you clarity to keep your pipelines clean and drift-free.
If you are running a modern SOC or managing complex infrastructure, you are likely drowning in a sea of raw logs. Sorting through this data to isolate an incident takes valuable time—time you don’t have when a potential breach is unfolding. What if you could instantly translate those technical logs into plain, actionable language right inside your search pipeline? Sounds simple, right?
With the release of the Splunk AI Toolkit, this capability is something you can implement today. By bringing generative AI directly into the Search Processing Language (SPL) pipeline via the | ai command, Splunk allows you to send search results to a Large Language Model (LLM) and parse the response as a native field. However, before you go pointing an LLM at your production data streams, there are critical performance and data governance hurdles you need to consider. Let us dive into how the toolkit works, how to use it effectively, and how to keep your data secure.
Mastering the Splunk AI Toolkit Setup
The Splunk AI Toolkit (formerly known as the Machine Learning Toolkit) integrates public and private generative AI platforms into your existing Splunk workflows. To get this up and running, your environment must meet a few baseline infrastructure requirements:
Splunk Platform: Splunk Enterprise or Splunk Cloud version 9.1 or later.
Python for Scientific Computing: You must install this specific add-on on your search head, as it serves as the underlying interface between Splunk and external AI services.
Permissions: You will need an administrator account with the MLTK admin role to configure AI connections and manage access controls.
Once the prerequisites are checked, you use the Connection Management UI within the app to hook up your LLM providers. You simply input your provider API keys or tokens, define your endpoints, and set up your default models. The toolkit supports a wide variety of models, including Google Gemini, OpenAI, Anthropic Claude, Microsoft Azure, and Amazon Bedrock.
Choosing the right model depends entirely on your specific task. For example, we find that Google’s Gemini models are highly economical and fast for summarizing large volumes of event logs, while Claude often excels at interpreting complex code or generating highly precise configurations.
Three Game-Changing Use Cases for DevSecOps
Once your connection is active, the real magic happens in the search bar. By appending the | ai command to your queries, you can transform how your team triages incidents. Here are three practical ways we use the toolkit to optimize daily operations:
1. Automated Field Extraction for Unfamiliar Logs
Onboarding a new, unstructured log source usually requires writing tedious regular expressions (regex). The Splunk AI Toolkit can analyze a messy log sample and automatically generate a usable regex pattern for you.
Pro Tip: Don’t treat AI regex as production-ready code. It is an excellent starting point to speed up early-stage pipeline analysis, but you should always validate the pattern against a larger dataset and use the native rex command for final production deployment.
2. High-Speed Event Summarization
When an outage occurs, your on-call engineers do not have time to look up obscure error codes across five different vendor documentation sites. You can pass error logs directly to the LLM to get an executive-ready brief of what went wrong. By strictly formatting the prompt to return clean JSON data, you can seamlessly feed these summaries into corporate Slack channels, IT support tickets, or daily ops updates.
3. Contextual Anomaly Detection
Splunk’s native math functions are fantastic at calculating standard deviations and identifying metric spikes. However, numbers alone do not give you context. By passing an aggregated numeric array (like a 5-minute volume bucket) to the LLM, the toolkit can explain the spike relative to your historical baseline in plain language. This gives your security analysts instant, clear documentation to include in incident triage tickets.
Solving the GenAI Data Security Dilemma
The benefits of generative AI are clear, but if you are working in a regulated industry, you are probably asking a critical question: What happens to our data when it leaves our network?
+----------------------------------------------------------------------+
| THE GENERAL DATA PRIVACY RISK |
| |
| [ Your Secure Logs ] ---> ( Public API Endpoint ) ---> [ Cloud LLM ] |
| | |
| v |
| Data Retained for |
| Model Training! |
+----------------------------------------------------------------------+
Sending raw log files to public endpoints poses serious compliance and legal risks. Sensitive data like Personally Identifiable Information (PII), access tokens, or proprietary system architectures could be logged and retained by external vendors for model training.
To mitigate these risks, we highly recommend adopting a Zero-Egress architecture by routing your Splunk AI Toolkit queries to a localized LLM (such as an on-premise Ollama instance running Llama 3).
+-----------------------------------------------------------------------+
| ZERO-EGRESS LOCAL ARCHITECTURE |
| |
| [ Splunk Enterprise ] ---> ( Local Network ) ---> [ On-Prem Ollama ] |
| | |
| v |
| Data Never Leaves |
| Your Corporate DMZ |
+-----------------------------------------------------------------------+
Running your models locally ensures that your data never exits your corporate security boundary. Additionally, you can utilize Single Sign-On (SSO) and role-based access control (RBAC) to ensure that the AI only retrieves and processes data that the executing user is explicitly permitted to see. Keep in mind that running local models requires dedicated hardware considerations—specifically, sufficient GPU memory to handle concurrent user queries and large token context windows.
Summary and Next Steps
The Splunk AI Toolkit is a powerful asset for teams looking to accelerate log analysis, automate regex creation, and enrich incident alerts with natural language context. However, the key to a successful deployment lies in balancing operational speed with strict data governance. By aggregating your data before sending payloads and utilizing local LLM models where data privacy is paramount, you can enjoy the best of both worlds: cutting-edge efficiency and uncompromised security.
Discovered Intelligence Inc., 2026. Unauthorized use and/or duplication of this material without express and written permission from this site’s owner is strictly prohibited. Excerpts and links may be used, provided that full and clear credit is given to Discovered Intelligence, with appropriate and specific direction (i.e. a linked URL) to this original content.
https://discoveredintelligence.com/wp-content/uploads/2026/08/Copy-of-Splunk-AI-Toolkit-v2-7.png20002000Matteo Aquinohttps://discoveredintelligence.com/wp-content/uploads/2013/12/DI-Logo1-300x137.pngMatteo Aquino2026-08-07 14:42:512026-08-10 14:37:43Boosting Sec Ops Efficiency: A Practical Guide to the Splunk AI Toolkit
We’re excited to announce the public availability of our Update Cribl Lookup app for Splunk, a new integration that sends results from Splunk searches directly to lookups in Cribl Cloud.
In Cribl Stream, lookups are often a key part of enrichment, filtering, and routing decisions, which means keeping them current can have a direct impact on how data is processed downstream.
Traditionally, maintaining Cribl Stream lookups can become a separate operational task: export data, reformat it, upload it, validate it, and then deploy it to the right worker group. The Update Cribl Lookup app removes that friction by letting teams use the searches they already run in Splunk to update Cribl lookups directly, either interactively in SPL or automatically through alerting workflows.
Why we built it
Many of our customers already use Splunk as the place where useful operational and security context comes together. That context might include threat indicators, suspicious IPs, user access patterns, asset inventories, allow or deny lists, or dynamically generated reference data that would be even more valuable if it could immediately influence processing in Cribl.
This app was built to close that gap. Instead of treating Splunk as the system where data is only analyzed after the fact, the app makes it possible to take the result of a search and push it back into the data pipeline by updating a Cribl lookup that Stream can use right away.
What the app does
The app gives you two ways to update Cribl lookups from Splunk search results.
A custom streaming command, | updatecribllookup, for on-demand and scheduled SPL-driven workflows.
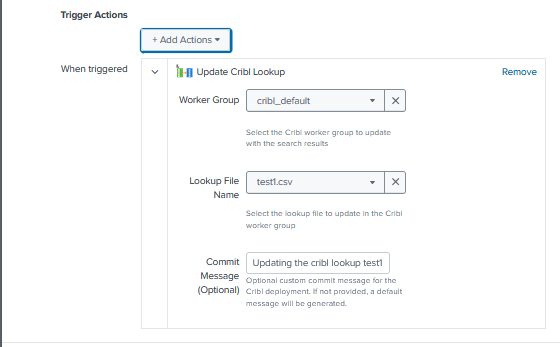
A modular alert action, “Update Cribl Lookup,” for automatically updating a lookup when an alert triggers
Both paths use the same back end, so you can test a workflow interactively in search first and then operationalize the same logic as an alert action.
How it works
The app takes search results from Splunk, validates the selected Cribl configuration, authenticates to Cribl Cloud using OAuth credentials, converts the results into CSV, uploads that data to the target lookup, and then deploys the change to the selected worker group.
The app supports multiple Cribl environments, worker groups and lookup definitions, managed through the configuration page.
Key Capabilities
Supports both a search command and alert action, giving flexibility for ad hoc, scheduled and event-driven workflow
Tested on on-prem and Cribl Cloud environments
Works with both memory and disk-based Cribl lookups.
Tested with disk-based lookups as large as 500MB
Validates configuration before execution, reducing failed runs caused by missing worker groups, disabled lookups, or invalid parameters.
Uses OAuth 2.0 authentication for Cribl Cloud and stores secrets securely in Splunk’s credential store
Provides detailed logging for operations, errors, and debugging through updatecribllookup.log and Splunk internal logging workflows
Example Use Cases
This app is useful anywhere Splunk can produce a dataset that should become operational reference data in Cribl
Security teams can update a lookup of active threat indicators from high-severity detections, allowing Cribl to enrich or route matching events immediately.
Access monitoring teams can maintain lists of suspicious users or source IPs based on failed login activity detected in Splunk
Operations teams can sync dynamic inventories, ownership mappings, or application reference data into Cribl to improve downstream enrichment and routing.
For example, a search identifying recently observed threat indicators can feed an activethreats.csv lookup in a security worker group, while a failed-login detection can maintain a suspicioususers.csv for downstream handling.
Specifies the Cribl worker group configuration to use for the lookup update. This value must match a worker group defined and enabled in the app’s configuration.
Use cribl_default when you want to target Cribl’s default worker group,
If the worker group is missing, disabled, or misspelled, validation will fail before the update runs.
lookup=<string>
Specifies the name of the lookup file to update in Cribl. This should match a lookup definition that has been configured and enabled in the app. The value should be a CSV filename such as activethreats.csv. The target lookup must exist in the intended Cribl environment.
lookupmode=<string>
Controls how the lookup should be handled in Cribl. Supported values are auto (default), memory, and disk.
commitmessage=<string>
Specifies an optional custom git commit message for the Cribl deployment triggered by the update. This can be useful for tracking why a lookup was updated or associating a deployment with a search or workflow. If no commit message is provided, the app uses a default commit message identifying the search name, SID, and lookup name.
This updates the lookup and includes a custom deployment message.
Using the alert action
The alert action makes the same capability available with convenient drop down selection for workergroup and lookup name. It also adds Splunk alert triggering rules (for instance, only trigger when event count > 0).
When creating the alert, a form is presented to set the parameters
The workflow in the back end that connects, updates and commits the lookup are the same as for the search command.
We’re excited to announce the public availability of our Cribl Search App for Splunk, an integration that lets you query data via Cribl Search—directly from the Splunk search interface.
Whether you’re hunting for threats in long-term archives or reporting on a high-volume API that may not be indexed, this app allows you to bring the results back into Splunk as standard events without the requirement to index. No more switching tabs; no need for “rehydration” of data from Cribl to be able to use it in Splunk searches.
The Cribl Search App for Splunk introduces a custom generating command, | criblsearch, to your Splunk environment. It sends your Cribl Query request to Cribl Search and streams the results back into your Splunk search pipeline.
Once the data hits Splunk, you can treat it just like any other event in SPL. You can pipe it into stats, eval, outputlookup, use on your favourite dashboards, or write it to an index with collect.
Enterprise Auth: Authenticates to Cribl Cloud using OAuth and securely stores Credentials using Splunk Secure Credential storage
Any Splunk compatible: Built to meet Splunk Cloud app vetting standards for seamless installation in both on-prem and cloud Splunk environments.
Cribl Search: A Primer
Cribl search allows you to search data where it lives. It can search data from many sources including: Cribl Lake, Cribl Edge, Amazon Security Lake, Amazon S3, Azure Blob Storage, Azure Data Explorer, Google Cloud Storage, Elasticsearch, Opensearch, Prometheus, Snowflake, ClickHouse, and data from quite a few APIs (AWS, Azure, GCP, Google Workspace, Microsoft Graph, Okta, Tailscale, Zoom, and a Generic http API data source provider that allows you to search ones not already covered)
The benefits of Cribl Search are:
Slash Costs: Access “low-value” logs in cheap object storage (S3). Search them only when you need them.
Instant Visibility: Access logs where they reside, no requirement to move or store them elsewhere.
Zero Infrastructure Bloat: Scale your search capabilities without adding more hardware.
1. Incident Response: Finding the initial compromise from long-term storage
The Challenge: An alert triggers today, but the compromise started 45 days ago. Data in Splunk is set to age out at 30 days, so those logs were moved to cold storage. The Solution: Pivot instantly to your S3 archive using Cribl Search directly in Splunk:
| criblsearch query="dataset:'firewall_archive' latest=-30d src_ip=='192.0.2.50' dest_ip=='27.133.154.218'" | stats count by action, dst_port | where action!="Blocked"
Impact: Get your full forensic timeline in a few minutes, not hours of manual data recovery, and no need to go into Cribl to set up a rehydration job for these events to be available.
2. High-Volume, Low-Value Logs
The Challenge: Your API generates 5TB of “200 OK” logs daily. Indexing them may not be valuable, but you need them for monthly compliance reports. The Solution: Run the audit search across your data lake using Cribl Search and bring only the summary data needed for the report back to Splunk:
| criblsearch query="dataset:'api_logs' | where response_time > 5000 | summarize avg(response_time) AS avg_latency by endpoint" | table avg_latency endpoint | outputlookup monthly_api_report.csv
Impact: 100% visibility for 0% additional indexing cost.
3. Cross-Cloud Correlation (The “Power Join”)
The Challenge: You suspect a credential spray attack hitting both AWS and Azure, but the logs live elsewhere. The Solution: Use Splunk to join results from the two datasets accessible via Cribl Search:
| criblsearch query="dataset:'aws_cloudtrail' event=='ConsoleLogin'" | rename sourceIPAddress AS src_ip, userIdentity.principalId AS user | append [ | criblsearch query="dataset:'azure_audit' event=='SignInActivity'" | rename ipAddress AS src_ip, userPrincipalName AS user ] | stats count values(user) by source_ip | where count > 5
Impact: Multi-cloud threat hunting from a single search bar.
When was the last time you actually looked forward to upgrading your Splunk Universal Forwarders (UFs)? If you’re like most of the engineers we talk to, UFs are the last things to get touched. They’re usually stuck on the back burner because the sheer effort of touching hundreds—or thousands—of endpoints is incredibly tedious. While we focus our energy on keeping the core Splunk instances shiny and updated, the UF fleet often lingers several versions behind, creating a maintenance debt that only gets heavier over time. But what if we told you there’s finally a native way to solve this headache?
The “Back Burner” Dilemma: Why UFs Are So Hard
In the past, we’ve really only had three ways to handle these upgrades: manual, scripted, or through external automation platforms like Ansible or SCCM. If you’re a smaller shop, you’re likely doing manual installs, which means an engineer has to remotely access or physically touch every single box. Even if you’re a bit more mature and use scripts, it’s still a fragmented process.
The largest, most “mature” customers have already moved to heavy-duty automation platforms to manage their fleet, and they’ve built their own processes for this. But for everyone else—the folks relying on manual or basic scripted processes—Splunk didn’t have a native solution. Until now.
The Splunk Remote Upgrader
The Splunk Remote Upgrader is a free, Splunk-supported tool available as two separate apps on Splunkbase – one for Linux and one for Windows. It’s designed to run right alongside your existing UF on the endpoint.
Essentially, it acts as a separate application that monitors a predetermined directory (usually under temp) for new installation packages. As soon as it sees a new package land in that directory, it takes over the installation process for you.
What Can It Actually Upgrade?
Target Versions: It can upgrade UFs to any version 9.0 or higher.
Starting Point: You can use this process if your current forwarder is at version 8.0 or higher.
Security First: It only supports signed UF packages. This is why the target must be 9+, as these versions include the necessary signature files for verification.
OS Support: Currently, available for Linux and Windows platforms.
The Deployment Process
The biggest point of confusion we see is the relationship between the Upgrader and the Forwarder package. Think of them as two distinct pieces of the same puzzle.
1. Initial Setup
You still have to do the “first mile” yourself. You need to get the Remote Upgrader installed on the endpoint machine manually or through your existing external tools first. Once that Remote Upgrader daemon is running, it starts its “watch” on the /tmp/SPLUNK_UPDATER_MONITORED_DIR/ folder.
2. Preparing the Package
On your Deployment Server, you’ll prepare a package that contains the new UF version you want to deploy, along with its signature (.sig) file.
3. Execution and Monitoring
When you push this application via the Deployment Server, the UF pulls it down. The package contains a script that copies the new files over to the temp directory the Upgrader is monitoring.
Once the Upgrader detects those files, the real work begins:
Three Strikes Rule: The Upgrader will try the installation up to three times if it fails.
Timeout Safety: If an attempt gets stuck for more than five minutes, it gives up on that attempt.
The Safety Net: If all attempts fail, it triggers an automatic rollback to your previous version. It even keeps a backup of your old configuration for 30 days by default, just in case.
Ready to finally tackle that fleet of 500 forwarders? It’s not just about the convenience; it’s about the peace of mind knowing you have a centralized, logged, and recoverable way to stay current.
Real-World Considerations and Constraints
While we’re big fans of this new tool, we have to stay grounded in reality. It’s not a “set it and forget it” magic wand for every scenario.
Initial Effort: As we mentioned, the very first install of the Upgrader must be manual. However, once it’s there, the Upgrader can actually upgrade itself automatically in the future.
Storage Requirements: You need at least 1GB of free space on the endpoint to handle the packages and the backups.
Deployment Server Strategy: If you have a massive environment, you probably don’t want to hit 1,000 servers at once. You’ll need to be creative with your Server Classes to roll out the upgrades in waves.
Windows Requirements: For those of you on Windows, make sure PowerShell scripting is enabled, as the process relies on it to function.
Conclusion
By adopting the Splunk Remote Upgrader, we’re moving away from the era of “neglected forwarders” and into a world of centralized, secure lifecycle management. It reduces maintenance overhead, ensures your fleet is consistent with the latest security patches, and lets you adopt new features faster than ever before. It might take a bit of initial legwork to get the Upgrader daemon onto your hosts, but the long-term payoff for your operations and security posture is massive.
Need help? If you need help architecting a massive UF rollout, contact us today – we’d love to help you streamline your data pipeline.
Discovered Intelligence Inc., 2026. Unauthorized use and/or duplication of this material without express and written permission from this site’s owner is strictly prohibited. Excerpts and links may be used, provided that full and clear credit is given to Discovered Intelligence, with appropriate and specific direction (i.e. a linked URL) to this original content.
https://discoveredintelligence.com/wp-content/uploads/2026/02/remote-universal-forwarder-upgrader.png12001200Dhiren Meswaniahttps://discoveredintelligence.com/wp-content/uploads/2013/12/DI-Logo1-300x137.pngDhiren Meswania2026-02-10 14:49:182026-02-10 14:49:19Splunk Universal Forwarder Upgrades: From Manual Pain to Automated Gain
We’ve all been there. You’re ready to modernize your observability pipeline. You’ve got the green light to move from legacy syslog servers (like syslog-ng) to Cribl Stream. It sounds like a straightforward lift-and-shift, right? But then you flip the switch, and suddenly your downstream SIEM is screaming about unparsed events, your timestamps are drifting, and your load balancers are pinning traffic to a single node.
https://discoveredintelligence.com/wp-content/uploads/2025/12/zero-change-migration.png12001200Terry Mulliganhttps://discoveredintelligence.com/wp-content/uploads/2013/12/DI-Logo1-300x137.pngTerry Mulligan2025-12-30 15:41:382026-01-13 16:26:50Migrating Syslog to Cribl Stream: The Art of the “Zero Change” Migration
Splunk Asset and Risk Intelligence (Splunk ARI) discovers and reports on risks affecting assets and identities. This risk discovery is performed in real-time, ensuring that risks can be quickly addressed, helping to limit exposure and increase overall security posture. In this post, we highlight three use cases related to asset risk using Splunk ARI.
https://discoveredintelligence.com/wp-content/uploads/2025/04/ari_cybersecurity_frameworks.png8321402Discovered Intelligencehttps://discoveredintelligence.com/wp-content/uploads/2013/12/DI-Logo1-300x137.pngDiscovered Intelligence2025-04-08 08:52:002025-06-10 17:17:50Finding Asset and Identity Risk with Splunk Asset and Risk Intelligence
Data protection is a critical priority for any organization, especially when dealing with sensitive information like personal identifiable information (PII) and protected health information (PHI) data. Implementing robust protection mechanisms not only ensures compliance with regulations like the General Data Protection Regulation (GDPR) but also mitigates the risk of data breaches.
https://discoveredintelligence.com/wp-content/uploads/2025/01/field_filters.jpg7201000Discovered Intelligencehttps://discoveredintelligence.com/wp-content/uploads/2013/12/DI-Logo1-300x137.pngDiscovered Intelligence2025-01-21 15:45:242025-01-21 15:47:43Field Filters 101: The Basics You Need to Know
If your Cribl environment was set up a few years ago, it might be time to revisit some of your settings—particularly the Persistent Queue (PQ) settings on your source inputs. Recently, while troubleshooting an issue, I discovered that the PQ settings were the root cause of the problem. I wanted to share my findings in case they help you optimize your Cribl setup.
https://discoveredintelligence.com/wp-content/uploads/2024/11/persistent_queues.jpg6651000Terry Mulliganhttps://discoveredintelligence.com/wp-content/uploads/2013/12/DI-Logo1-300x137.pngTerry Mulligan2024-12-10 17:08:082024-12-11 18:32:18Beyond Smart: When ‘Always On’ Mode is the Best Choice for Cribl Persisent Queues
With the recent release of Splunk Asset and Risk Intelligence (ARI), you may be looking for a better understanding of this great new solution and how you may get started. We have compiled a list of materials and resources you can use to help achieve this goal.
Read and Learn
Product overviews and briefs
If this is your first time reading up on Splunk Asset and Risk Intelligence, check these out first:
Get a quick look at the Splunk ARI interface with screen shots of the platform, along with information about its features and capabilities through the following blog posts:
It is often quicker, easier and more cost effective to get the Splunk ARI experts in. Our award winning consultants are highly trained on Splunk ARI and will ensure your continued success.
https://discoveredintelligence.com/wp-content/uploads/2018/10/gettingstarted.jpg286420Discovered Intelligencehttps://discoveredintelligence.com/wp-content/uploads/2013/12/DI-Logo1-300x137.pngDiscovered Intelligence2024-12-02 15:02:342024-12-03 16:58:22Help Getting Started with Splunk Asset and Risk Intelligence (ARI)