Introducing the Update Cribl Lookup App for Splunk
We’re excited to announce the public availability of our Update Cribl Lookup app for Splunk, a new integration that sends results from Splunk searches directly to lookups in Cribl Cloud.
In Cribl Stream, lookups are often a key part of enrichment, filtering, and routing decisions, which means keeping them current can have a direct impact on how data is processed downstream.
Traditionally, maintaining Cribl Stream lookups can become a separate operational task: export data, reformat it, upload it, validate it, and then deploy it to the right worker group. The Update Cribl Lookup app removes that friction by letting teams use the searches they already run in Splunk to update Cribl lookups directly, either interactively in SPL or automatically through alerting workflows.
Why we built it
Many of our customers already use Splunk as the place where useful operational and security context comes together. That context might include threat indicators, suspicious IPs, user access patterns, asset inventories, allow or deny lists, or dynamically generated reference data that would be even more valuable if it could immediately influence processing in Cribl.
This app was built to close that gap. Instead of treating Splunk as the system where data is only analyzed after the fact, the app makes it possible to take the result of a search and push it back into the data pipeline by updating a Cribl lookup that Stream can use right away.
What the app does
The app gives you two ways to update Cribl lookups from Splunk search results.
- A custom streaming command,
| updatecribllookup, for on-demand and scheduled SPL-driven workflows. - A modular alert action, “Update Cribl Lookup,” for automatically updating a lookup when an alert triggers
Both paths use the same back end, so you can test a workflow interactively in search first and then operationalize the same logic as an alert action.
How it works
The app takes search results from Splunk, validates the selected Cribl configuration, authenticates to Cribl Cloud using OAuth credentials, converts the results into CSV, uploads that data to the target lookup, and then deploys the change to the selected worker group.
The app supports multiple Cribl environments, worker groups and lookup definitions, managed through the configuration page.
Key Capabilities
- Supports both a search command and alert action, giving flexibility for ad hoc, scheduled and event-driven workflow
- Tested on on-prem and Cribl Cloud environments
- Works with both memory and disk-based Cribl lookups.
- Tested with disk-based lookups as large as 500MB
- Validates configuration before execution, reducing failed runs caused by missing worker groups, disabled lookups, or invalid parameters.
- Uses OAuth 2.0 authentication for Cribl Cloud and stores secrets securely in Splunk’s credential store
- Provides detailed logging for operations, errors, and debugging through updatecribllookup.log and Splunk internal logging workflows
Example Use Cases
This app is useful anywhere Splunk can produce a dataset that should become operational reference data in Cribl
- Security teams can update a lookup of active threat indicators from high-severity detections, allowing Cribl to enrich or route matching events immediately.
- Access monitoring teams can maintain lists of suspicious users or source IPs based on failed login activity detected in Splunk
- Operations teams can sync dynamic inventories, ownership mappings, or application reference data into Cribl to improve downstream enrichment and routing.
For example, a search identifying recently observed threat indicators can feed an activethreats.csv lookup in a security worker group, while a failed-login detection can maintain a suspicioususers.csv for downstream handling.
Using the streaming command
Syntax
... | updatecribllookup workergroup=<string> lookup=<string> [lookupmode=<string>] [commitmessage=<string>]
Arguments
workergroup=<string> | Specifies the Cribl worker group configuration to use for the lookup update. This value must match a worker group defined and enabled in the app’s configuration. Use cribl_default when you want to target Cribl’s default worker group, If the worker group is missing, disabled, or misspelled, validation will fail before the update runs. |
lookup=<string> | Specifies the name of the lookup file to update in Cribl. This should match a lookup definition that has been configured and enabled in the app. The value should be a CSV filename such as activethreats.csv. The target lookup must exist in the intended Cribl environment. |
lookupmode=<string> | Controls how the lookup should be handled in Cribl. Supported values are auto (default), memory, and disk. |
commitmessage=<string> | Specifies an optional custom git commit message for the Cribl deployment triggered by the update. This can be useful for tracking why a lookup was updated or associating a deployment with a search or workflow. If no commit message is provided, the app uses a default commit message identifying the search name, SID, and lookup name. |
Examples
Basic update
… | updatecribllookup workergroup=cribl_default lookup=activethreats.csv
This sends the search results to the activethreats.csv lookup in the specified worker group.
Explicit lookup mode
… | updatecribllookup workergroup=security lookup=activethreats.csv lookupmode=memory
This updates the target lookup and explicitly sets the lookup mode to memory.
With commit message
With commit message
… | updatecribllookup workergroup=syslog_prod lookup=cmdb_enrichment.csv commitmessage="Refreshing CMDB enrichment data"
This updates the lookup and includes a custom deployment message.
Using the alert action
The alert action makes the same capability available with convenient drop down selection for workergroup and lookup name. It also adds Splunk alert triggering rules (for instance, only trigger when event count > 0).
When creating the alert, a form is presented to set the parameters
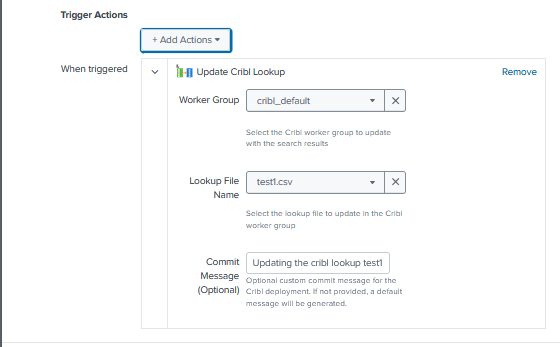
The workflow in the back end that connects, updates and commits the lookup are the same as for the search command.
Download today from Splunkbase
UpdateCriblLookup is available right now from Github.
Documentation can be found at: https://github.com/DiscoveredIntelligence/update_cribl_lookup_app_for_splunk/blob/main/README.md
For support, to request feature enhancements or to give us your feedback – Contact us at support@discoveredintelligence.ca.