Posts

learn Cribl Stream

Cribl Stream: Things I wish I knew before diving in

If you are like me when I started with Cribl, you will have plenty of Splunk knowledge but little to no Cribl experience. I had yet to take the training, had no JavaScript experience, and only had a basic understanding of Cribl, but I didn’t let that stop me and just dove in. Then I immediately struggled because of my lack of knowledge and spent countless hours Googling and asking questions. This post will list the information I wish I had possessed then, and hopefully make your first Cribl experience easier than mine.

Cribl Quick Reference Guide

If I could only have one item on my wish list, it would be to be aware of the Cribl Quick Reference Guide. This guide details basic stream concepts, performance tips, and built-in and commonly used functions.

Creating that first ingestion, I experienced many “how do I do this” moments and searched for hours for the answers, such as “How do I create a filter expression?” Generally, filters are JavaScript expressions essential to event breakers, routes, and pipelines. I was lost unless the filter was as simple as 'field' == 'value.' I didn’t know how to configure a filter to evaluate “starts with,” “ends with,” or “contains.” This knowledge was available in the Cribl Quick Reference Guide in the “Useful JS methods” section, which documents the most popular string, number and text Javascript methods.

Common Javascript Operators

OperatorDescription
&&Logical and
||Logical or
!Logical not
==Equal – both values are equal – can be different types.
===Strict equal – both values are equal and of the same type.
!=Returns true if the operands are not equal.
Strict not equal (!==)Returns true if the operands are of the same type but not equal or are of different kinds.
Greater than (>)Returns true if the left operand is greater than the right operand.
Greater than or equal (>=)Returns true if the left operand is greater than or equal to the right operand.
Less than (<)Returns true if the left operand is less than the right operand.
Less than or equal (<=)Returns true if the left operand is less than or equal to the right operand.

Regex

Cribl uses a different flavour of Regex. Cribl uses ECMAScript, while Splunk uses PCRE2. These are similar, but there are differences. Before I understood this, I spent many hours frustrated that my Regex code would work in Regex101 but fail in my pipeline.  

Strptime

It’s almost identical to the version that Splunk uses, but there are a few differences. Most of my problems were when dealing with milliseconds. Cribl uses %L, while Splunk uses %3Q or %3N.   Consult D3JS.org for more details on the strptime formatters.

JSON.parse(_raw)

When the parser function in a pipeline does not parse your JSON event, it may be because the JSON event is a string and not an object. Use an eval function with the Name as _raw and the Value Expression set to JSON.parse(_raw), which will convert the JSON to an object. A side benefit of JSON.parse(_raw) is that it will shrink the event’s size, so I generally include it in all my JSON pipelines.

JSON parse example

Internal Fields

All Cribl source events include internal fields, which start with a double underscore and contain information Cribl maintains about the event. Cribl does not include internal fields when routing an event to a destination. For this reason, internal fields are ideal for temporary fields since you do not have to exclude them from the serialization of _raw. To show internal fields, click the … (Advanced Settings) menu in the Capture window and toggle Show Internal Fields to “On” to see all fields.

Cribl source internal fields

Event Breaker Filters for REST Collector or Amazon S3  

Frequently, expressions such as “sourcetype=='aws:cloudwatchlogs:vpcflow‘” are used in an Event breaker filter, but sourcetype cannot be used in an Event Breaker for a REST Collector or an Amazon S3 Source. This is because this sourcetype field is set using the input’s Fields/Metadata section, and the Event Breaker is processed before the Field/Metadata section. 

For a REST collector, use “__collectible.collectorId=='<rest collector id>'” internal field in your field expression, which the REST collector creates on execution. 

Amazon S3 source

For further information, refer to the Cribl Docs – Event Processing Order.

Dropping Null fields

One of Cribl Stream’s most valuable functions is the ability to effortlessly drop fields that contain null values. Within the parser function, you can populate the “Fields Filter Expression” with expressions like value !== null.

Some example expressions are:

ExpressionMeaning
value !== nullDrop any null field
value !== null || value==’N/A’Drop any field that is null or contains ‘N/A’
dropping null fields

Once I obtained these knowledge nuggets,  my Cribl Stream was more efficient.  Hopefully, my pain will be your gain when you start your Cribl Stream journey.


Looking to expedite your success with Splunk and Cribl? Click here to view our Professional Service offerings.

© Discovered Intelligence Inc., 2024. Unauthorized use and/or duplication of this material without express and written permission from this site’s owner is strictly prohibited. Excerpts and links may be used, provided that full and clear credit is given to Discovered Intelligence, with appropriate and specific direction (i.e. a linked URL) to this original content.

Splunk asset discovery

Splunk Asset and Risk Intelligence – a CAASM Solution for Splunk

Image credit: https://www.splunk.com/en_us/products/asset-and-risk-intelligence.html

At the recent Splunk .Conf in Las Vegas a couple of weeks ago, we were able to get a detailed demo of Splunk’s new and exciting Splunk Asset and Risk Intelligence (Splunk ARI) security solution. What a great solution and one that is much needed within their security solution portfolio. Splunk ARI falls into a category of products known as CAASM – Cyber Asset Attack Surface Management. In this post, we dive a little deeper into what CAASM is, why it is critical tool for your organization and how Splunk ARI can help.

Read more

4 Enhancements to Elevate Your Splunk Platform

Still winding down from the incredible experience at .conf24, where we delved into the latest market trends, we’ve uncovered several fascinating enhancements for the Splunk platform. These improvements not only elevate the performance and efficiency of Splunk but also offer exciting features that will be available in future releases. Join us as we explore four powerful upgrades that can be used in your Splunk environment.

Read more

Learning Splunk with the new ‘Getting Started with Splunk’ Video Series

Looking to enhance your understanding of Splunk in a fun and concise way?

Introducing the benefits and features of Cribl Lake

April marked the beginning of a new era for Cribl with the introduction of Cribl Lake, which brings Cribl’s suite of products full circle in the realm of data management. In this post we dive a bit deeper into some of the benefits and features of Cribl Lake.

Read more

Building a Unified View: Integrating Google Cloud Platform Events with Splunk

By: Carlos Moreno Buitrago and Anoop Ramachandran

In this blog we will talk about the processes and the options we have to collect the GCP events and we will see how to collect those in Splunk. In addition, we will even add integration with Cribl, as an optional step, in order to facilitate and optimize the process of information ingestion. After synthesizing all of this great information, you will have a great understanding of the available options to take, depending on the conditions of the project or team in which you work.

Read more

Harnessing Ingest-Time Eval Fields

Anyone who is familiar with writing search queries in Splunk would admit that eval is one of the most regularly used commands in their SPL toolkit. It’s up there in the league of stats, timechart, and table.

For the uninitiated, eval, just like in any other programming context, evaluates an expression and returns the result. In Splunk, especially when searching, holds the same meaning as well. It is arguably the Swiss Army knife among SPL commands as it lets you use an array of operations like mathematical, statistical, conditional, cryptographic, and text formatting operations to name a few.

Read more about eval here and eval functions here.

What is an Ingest-time Eval?

Until Splunk v7.1, the eval command was only limited to search time operations. Since the release of 7.2, eval has also been made available at index time. What this means is that all the eval functions can now be used to create fields when the data is being indexed – otherwise known as indexed fields. Indexed fields have always been around in Splunk but didn’t have the breadth of capabilities for populating them until now.

Ingest-time eval doesn’t overlap with other common index-time configurations such as data filtering and routing, but only complements it. It lets you enrich the event with fields that can be derived by applying the eval functions on existing data/fields in the event.

One key thing to note is that it doesn’t let you apply any transformation to the raw event data, like masking.

When to use Ingest-time eval

Ingest-time eval can be used in many different ways, such as:

  • Adding data enrichment such as a data center field based on a host naming convention
  • Normalizing fields such adding a field with a FQDN when the data only contains a hostname
  • Using additional fields used for filtering data before indexing
  • Performing common calculations such as adding a GB field when there is only a MB field or the length of a field with a string

Ingest-time eval can also be used with metrics. Read more here.

When not to use Ingest-time eval

Ingest-time eval, like index-time field extractions, adds a performance overhead on the indexers or heavy forwarders (whichever is handling the parsing of data based on your architecture) as they will be evaluated on all events of the specific sourcetypes you define it for. Since the new fields are going to be permanently added to the data as they are indexed, the increase in disk space utilization needs to be accounted for as well. Also there is no reverting these new fields as these are indexed/persisted in the index. To remove the data, the ingest-time eval configurations would need to be disabled/deleted and letting the affected data age out.

When using Ingest-time eval also consider the following:

  • Validate if the requirement is something that can be met by having an eval function at search time – usually this should be yes!
  • Always use a new field name that’s not part of the event data. There should be no conflict with the field name that Splunk automatically extracts with the `KV_MODE=auto` extraction.
  • Always ensure you are applying eval on _raw data unless you have some index time field extraction that’s configured ahead of it in the transforms.conf.

Always ensure that your indexers or heavy forwarders have adequately hardware provisioned to handle the extra load. If they are already performing at full throttle, adding an extra step of processing might be that final straw. Evaluate and upgrade your indexing tier specs first if needed.

Now, lets see it in action!

Here is an Example…

Lets assume for a brief moment you are working in Hollywood, with the tiny exception that you don’t get to have coffee with the stars but just work with their “PCI data”. Here’s a sample of the data we are working with. It’s a sample of purchase details that some of my favorite stars made overseas (Disclaimer: The PCI data is fake in case you get any ideas 😉):

2019-12-09 23:46:44,283 - name=Tom Hardy, amount=2620.08063223, currency=USD, dest_country=Tanzania, cc=8888192373782645, cvc=151
2019-12-09 23:46:45,284 - name=Ryan Reynolds, amount=4229.66241228, currency=USD, dest_country=Canada, cc=9999047123456789, cvc=101
2019-12-09 23:46:48,288 - name=Frances McDormund, amount=6033.83328530, currency=USD, dest_country=Budapest, cc=9999513562353615, cvc=856
2019-12-09 23:47:11,320 - name=Daniel Day-Lewis, amount=5603.00466255, currency=USD, dest_country=Iceland, cc=9999463984323578, cvc=029
2019-12-09 23:47:21,333 - name=Clint Eastwood, amount=8321.50139290, currency=USD, dest_country=Sri Lanka, cc=8888847290573791, cvc=347
2019-12-09 23:47:22,335 - name=Tom Hardy, amount=3773.86328145, currency=USD, dest_country=Tanzania, cc=8888192373782645, cvc=151
2019-12-09 23:47:23,336 - name=Jeff Goldblum, amount=9475.63602049, currency=USD, dest_country=Sri Lanka, cc=8888485176493782, cvc=730

Now we are going to create some ingest-time fields:

  1. Making the name to all upper case (just for the sake of it)
  2. Rounding off the amount to two decimal places
  3. Applying a bank field based on the starting four digit of the card number
  4. Applying md5 hashing on the card number
  5. Applying a mask to the card number

First things first, lets set up our props.conf for the data with all the recommended attributes defined. What really matters in our case here is the TRANSFORMS attribute.

[finlog]
SHOULD_LINEMERGE=false
LINE_BREAKER=([\r\n]+)
TRUNCATE=10000
TIME_FORMAT=%Y-%m-%d %H:%M:%S,%f
MAX_TIMESTAMP_LOOKAHEAD=25
TIME_PREFIX=^
TRANSFORMS = fineval1, fldext1, fineval2 # order of values for transforms matter

Now let’s define how the transforms.conf should look like. This essentially is the place where we define all our eval expressions. Each expression is comma separated.

[fineval1]
INGEST_EVAL= uname=upper(replace(_raw, ".+name=([\w\s'-]+),\stime.*","\1")), purchase_amount=round(tonumber(replace(_raw, ".+amount=([\d\.]+),\scurrency.*","\1")),2)
# notice how in each case we have to operate on _raw as name and amount fields are not index-time extracted.

[fldext1]
REGEX = .+cc=(\d{15,16})
FORMAT = cc::"$1"
WRITE_META = true

[fineval2]
# INGEST_EVAL= cc=md5(replace(_raw, ".+cc=(\d{15,16})","\1"))
# have commented above as we need not apply the eval to the _raw data. fldext1 here does index time field extraction so we can apply directly on the extracted field as below...
INGEST_EVAL= cc1=md5(cc), bank=case(substr(cc,0,4)=="9999","BNC",substr(cc,0,4)=="8888","XBS",1=1,"Others"), cc2=replace(cc, "(\d{4})\d{11,12}","\1xxxxxxxxxxxx")

All the above settings should be deployed to the indexer tier or heavy forwarders if that’s where the data is originating from.

A couple things to note – you can define your ingest-time eval in separate stanzas if you choose to define them separately in the props.conf. Below is a use case for that. Here I have defined an index time field extraction to extract the value of card number. Then in a separate stanza, I used another ingest-time eval stanza to process on that extracted field. This is a good use case of reusability of regex (instead of applying it on _raw repeatedly) in case you need to do more than one operations on specific set of fields.

Now we need to do a little extra work that’s not common with a search time transforms setting. We have to add all the new fields created above to fields.conf with the attribute INDEXED=true denoting these are index time fields. This should be done in the Search Head tier.

[cc1]
INDEXED=true

[cc2]
INDEXED=true

[uname]
INDEXED=true

[purchase_amount]
INDEXED=true

[bank]
INDEXED=true

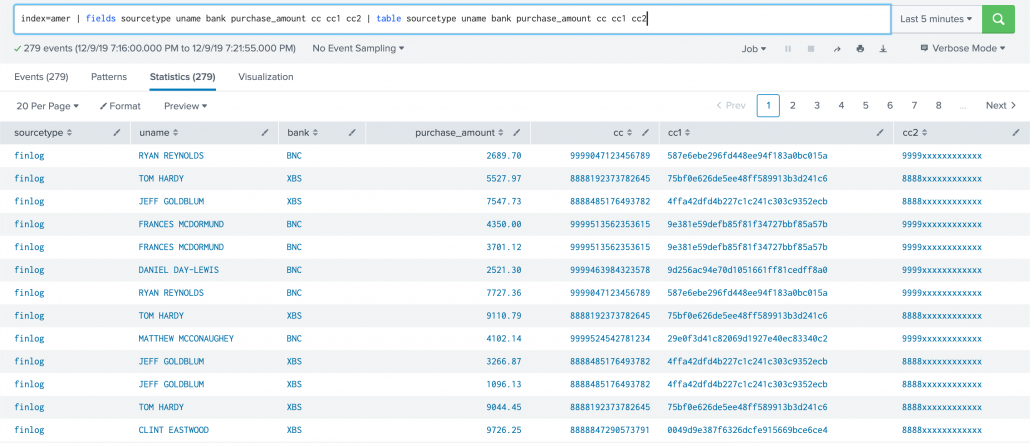
The result looks like this:

One important note about implementing Ingest-time eval configurations, is that they require manual edits to .conf files as there is no Splunk web option for it. If you are a Splunk Cloud customer, you will need to work with Splunk support to deploy them to the correct locations depending on your architecture.

OK so that’s a quick overview of Ingest-time eval. Hope you now have a pretty fair understanding of how to use them.

Looking to expedite your success with Splunk? Click here to view our Splunk Professional Service offerings.

© Discovered Intelligence Inc., 2020. Unauthorised use and/or duplication of this material without express and written permission from this site’s owner is strictly prohibited. Excerpts and links may be used, provided that full and clear credit is given to Discovered Intelligence, with appropriate and specific direction (i.e. a linked URL) to this original content.
Fun with Open Data: Splunking Bike Share Toronto

With the New Year, and cold winter, now upon us here in Toronto we thought it would be fun to kick it off by revisiting our award winning Hackathon entry from last years Splunk’s Partner Technical Symposium and adapting it to provide insights for our very own Toronto’s Bike Share platform leveraging their Open Data.

Read more

Splunk Enterprise 7.2 New Features

Splunk Enterprise 7.2 is the latest release from Splunk and was made available during Splunk .conf18 in Orlando. Many new features were added which will improve Splunk Enterprise from administration and user experience, to analytics and data onboarding. Read more

A Practical Example Using The Splunk Machine Learning Toolkit

In our previous blog we walked through steps on installing the Splunk Machine Learning Toolkit and showcased some of the analytical capabilities of the app. In this blog we will deep dive into an example dataset and use the ‘Predict Numeric Fields’ assistant to help us answer some questions about it.

The sample dataset used is from People’s dataset repository [Houghton] This multivariate sample dataset contains the following fields:

  • Net Sales/$ 1,000
  • Square Feet/ 1,000
  • Inventory/$ 1,000
  • Amt Spent on Advertising/$ 1,000
  • Size of Sales District/1000 families
  • No of Competitors in district

You can download a copy of the sample data here: greenfranchise.csv

What Questions do we want to ask?

We would like to understand the relationship between ‘Net Sales’ of Green Franchise and how it is impacted by the variables ‘Square Feet of Store’, ‘Inventory’, ‘Amount Spent on Advertising’, ‘Size of Sales District’ & ‘No of Competitors’. E.g Would an increase in ‘Inventory’ or ‘Amount Spent on Advertising’ increase or decrease ‘Net Sales’ for Greens?

The next few sections will walk you through uploading the data set and processing it in the Machine Learning Toolkit App.

Uploading the Sample Data Set

The CSV file was uploaded to Splunk from Settings -> Lookups -> Lookup table files (Add new). If you need more information on this step please consult the Splunk Docs here. Save the CSV file as greenfranchise.csv

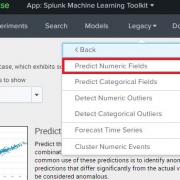
Once the file has been uploaded and saved as greenfranchise.csv, navigate to the Splunk Machine Learning Toolkit App, click on the ‘Legacy’ menu, Assistants and open the ‘Predict Numeric Fields’ Assistant. This screenshot and navigation may differ depending on which version of Splunk and the MLTK is installed. Assistants in version 3.2 can be found under the ‘Legacy’ tab.

App: Splunk Machine Learning Toolkit

splunk machine learning toolkit

Populate Model Fields

In the Create New Model tab, you can view the contents of the CSV file by running the below Splunk Query in the Search bar:

|  inputlookup greenfranchise.csv

This will automatically populate the panels with the fields in the csv file. Below the “Preprocessing Steps” we can see a second panel to choose the type of algorithm to apply to this lookup.

Selecting the Algorithm

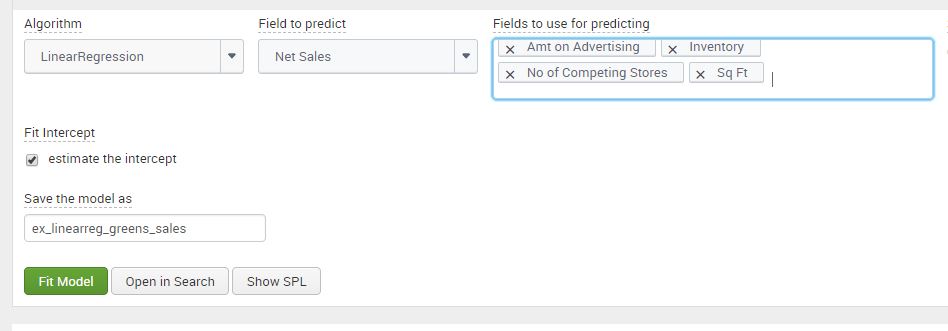
In the panel for selecting the algorithm, we can see the ‘Fields to predict’ and ‘Fields to use for predicting’ fields are automatically populated from the data. For this test we use the linear regression algorithm to forecast the ‘Net Sales’ of Green Franchises. Select “Net Sales” as the Field to predict, and in the Fields to use for predicting, select all of the remaining fields except for “Size of Sales District”.

If you’re interested in the math behind it, linear regression from the Machine Learning Toolkit will provide us with the Beta (relationship) co-efficient between ‘Net Sales’ and each of the fields. The residual of regression model is the difference between the explanatory/input variables and the predicted equation at each data point, which can be used for further analysis of the model.

Fitting Model

Once the Fields have been picked, you need to determine the ‘Split for Training’ ratio for the model. Select ‘No Split’ for the model to use all the data for creating a model. The split option allows the user to divide the data for training and testing. This means that X% of the data will used to create our model, and (100-X) % of the data withheld will be used to test the model.

Click on ‘Fit Model’ after setting the Split for the data. Splunk processes the data to display visuals which we can use to analyze the data. Name the model ‘ex_linearreg_greens_sales’, however, based on the users data, the model name should reflect the field to predict, the type of algorithm and the user it is assigned to, to reduce ambiguity on the models ownership and purpose.

Analyzing the Results

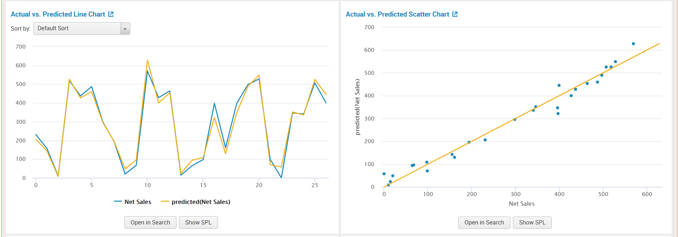
The first two panels show a Line and Scatter Chart of “Actual vs Predicted” data. Both panels present one of the richest methods to analyze the linear regression model. From the scatter and line plot we can observe that the data fits well. We can determine that there is a strong correlation between the model’s predictions and the actual results. Since the model has more than one input variable, examining the residual line chart and histogram next, will give us a more practical understanding.

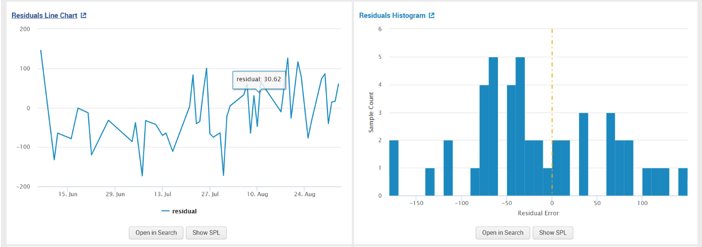
The second set of panels that we can use to analyse the model are residuals from the plot. From observing the “Residual Line Chart” and “Residual Histogram” we can see that there is large deviation from the center and the residuals appear to be scattered. A random scattering of the data points around the horizontal (x-axis) line signifies a good fit for the linear model. Otherwise, a pattern shape of the data points would indicate that a non-linear model from the MLTK should be used instead.

The last set of panels show us the R-squared of the model. The closer the value is to 1, better the fit of the regression model. The “Fit Model Parameters Summary” panel gives us the ‘Beta’ coefficients discussed in the ‘Selecting the Algorithm’ section. The assistant displays the data in a well-grounded and systematic setting. After analyzing the macro fit of the model, we can use the co-efficient of the variables create our equation for predicting ‘Net Sales’ :

In the last panel shown below, we can see our input variables under ‘Fit Model Parameters Summary’ and their values. We will assess in the next section on using these input variables to predict ‘Net_Sales‘.

Answering the Question: How is ‘Net Sales’ impacted by the Variables?

We can view the results of the model by running the following search:

| summary "ex_linearreg_greens_sales"

This Query will return the coefficients values of the linear regression algorithm. In our example for Greens, we observed that variable ‘X4’ are the number of competitors stores, an increment in competitors stores will reduce the ‘Net Sales‘ by approximately 12.62. While the variable ‘X5’ is the Sq Feet of the Store, and increment will increase the ‘Net Sales’ by approximately 23.69.

We can use the results from our model to forecast ‘Net Sales’ if the input variables (Sq Ft, Amt on Advertising etc) were different using the below Splunk search:

| makeresults | eval "Sq Ft"=5.8, Inventory=700, "Amt on Advertising"=11.5,"No of Competing Stores"=20 | apply ex_linearreg_greens_sales as "Predicted_Net_Sales"

We used makeresults to work our own values for the input variables. Once the fields have been defined we used the apply command in the MLTK to output the predicted value of the ‘Net Sales’ given the new values of the input variables. The apply command uses the ouput values the model learnt from the csv dataset and applies them to new information. We used  the ‘as’ command to alias the name of the predicted field as ‘Predicted_Net_Sales’. From the below screenshot we can observe that; 11.5 on Advertising, 700 on Inventory, 20 Competing stores nearby and 5.8 square feet of space predicts a Net Sales of approximately 306. Please note that all monetary variables are in $1,000 .

Summary

So to recap, we followed the following steps to answer our question of the data:

  • Uploaded the sample data set
  • Populated the model fields
  • Selected an algorithm
  • Fit the model
  • Analyzed the results

The Splunk Machine Learning Toolkit simplifies the steps for data preparation, reduces the steps needed to create a model, and saves the history of models we have executed and tested with. We can review the data before applying the algorithms allowing the user to standardize and adjust using MLTK capabilities or Splunk queries. The resulting statistic of the ‘Predict Numeric Fields’ assistant allows us to understand the dataset using machine learning.

Looking to expedite your success with Splunk? Click here to view our Splunk service offerings.

© Discovered Intelligence Inc., 2018. Unauthorised use and/or duplication of this material without express and written permission from this site’s owner is strictly prohibited. Excerpts and links may be used, provided that full and clear credit is given to Discovered Intelligence, with appropriate and specific direction (i.e. a linked URL) to this original content.

References

Houghton Mifflin, Data Sets, http://college.cengage.com/mathematics/brase/understandable_statistics/7e/students/datasets/mlr/frames/frame.html