Wiring up the Splunk OpenTelemetry Collector for Kubernetes
Organizations of all sizes are building / migrating / refactoring their software to be cloud-native. Applications are broken down into microservices and deployed as containers. Consequently there has been a seismic shift in the complexity of application components thanks to the intricate network of microservices calling each other. The traditional sense of “monitoring” them no longer makes sense, especially because containers are ephemeral in nature and are treated as cattle, instead of as pets.
How we look at the health of these systems has adapted away from host-based monitoring, to “Observability”, where applications and underlying infrastructure are instrumented together to send out signals, not just to detect problems, but to give insights into the performance, reliability and interoperability of the system as a whole as opposed to the health of individual components.
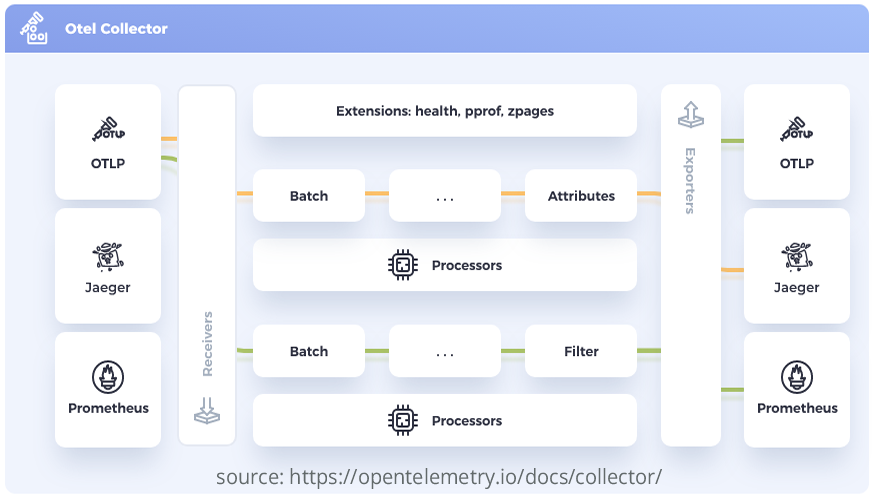
One of the most adopted technologies for orchestrating containers is Kubernetes which is the largest open source initiative under the Cloud Native Computing Foundation (CNCF). OpenTelemetry (Otel), the second largest open source project under CNCF umbrella, focuses on the Observability aspect in the cloud native world. One of the core components of OpenTelemetry is the Otel Collector as illustrated in the diagram below.
What does the OpenTelemetry Collector Do?
The OpenTelemetry Collector uses pipelines to receive, process and export data with components known as receivers, processors and exporters. The OpenTelemetry Collector has a core version and a contributions version. The core version provides receivers, processors and exporters for general use. The contribution version provides receivers, processors, and exporters for specific vendors and use cases.
In this blog, we look at the Splunk OpenTelemetry Collector for Kubernetes, from here on out referred to as SOCK (not an official acronym). The SOCK is a distribution of the OpenTelemetry Collector. This distribution is a project that bundles components from OpenTelemetry Core, OpenTelemetry Contrib, and other sources to provide data collection for multiple source platforms.
In addition to Splunk Enterprise, SOCK can also send data to Splunk Cloud and Splunk Observability Cloud. This includes receiving, processing and exporting metrics, traces and logs data. SOCK supersedes Splunk Connect for Kubernetes (SCK) as the de facto tool for collecting and sending logs and metrics data from your Kubernetes deployment to Splunk Enterprise.
SOCK consists of the below components:
- Receivers: Get data into the Collector from multiple sources.
- Processors: Perform operations on data before it’s exported. For example, filtering.
- Exporters: Send data to one or more backends or destinations.
- Extensions: Extend the capabilities of the Collector.
A pipeline defines a path the data follows in the Collector starting from reception, then further processing or modification, and finally when it exits the Collector through exporters. Pipelines operate on three data types: logs, traces, and metrics.
For this blog, we will focus on how to configure collecting and forwarding logs data using SOCK to a Splunk Enterprise deployment.
Recommended Prerequisites
Splunk recommends installing SOCK on your cluster using Helm Charts, if there is no need for advanced configurations. I have listed some of the prerequisites below
- Supported Kubernetes distributions
- Administrator access to the Kubernetes cluster you are deploying to
- Splunk Enterprise v8.0 or above
- Helm3 is supported. Helm2 is not supported.
- An index to receive data in Splunk Enterprise or Splunk Cloud
- A HEC token to authenticate to Splunk Enterprise or Splunk Cloud
For simplicity, let’s assume that the above prerequisites regarding distribution, access and version are met and that you’re aware of how to create indexes and HEC tokens in Splunk Platform and hence skipping those steps.
Configuration Values When Deploying Using Helm Charts
The next step is to create a values.yaml file to specify our configuration values when deploying using Helm Charts.
In its simplest form, the values.yaml file looks like this:
clusterName: <a cluster identifier for the cluster to which this is being deployed>
splunkPlatform:
token: <GUID>
endpoint: http://<splunk_platform_url>:8088/services/collector
logsEngine: otel
cloudProvider: ""
distribution: ""
insecureSkipVerify: true
Let me explain each attribute a bit below.
clusterName: This is a required value to identify your Kubernetes cluster which is available with all traces, metrics and logs as “k8s.cluster.name” attribute in Splunk
token: The Splunk HEC token created as part of the prerequisite step
endpoint: The HEC endpoint URL to send the data to
logsEngine: There are two logs collection engines available – fluentd | otel
- fluentd: This deploys fluentd container as a sidecar to collect logs and send them to the otel-collector agent for further processing.
- otel: uses native OpenTelemetry log collection
For Splunk Enterprise, it is recommended to use otel logs collection engine
cloudProvider: This is self explanatory and can be azure / gcp / aws or can be left blank if running other distributions like vanilla Kubernetes.
distribution: Configure distribution as below based on cloudProvider.
- “
aks” – (Azure Kubernetes Service) - “
eks” – (Amazon Elastic Kubernetes Service) - “
eks/fargate” – (Amazon Elastic Kubernetes Service with Fargate profiles ) - “
gke” – (Google Kubernetes Engine / Standard mode) - “
gke/autopilot” – (Google Kubernetes Engine / Autopilot mode) - “
openshift” – (RedHat OpenShift)
insecureSkipVerify: This flag determines whether to skip checking the certificate of the HEC endpoint when sending data over HTTPS. For now let’s set this to true to skip certificate check. We will come back to how to set certificates later.
Let’s deploy this using Helm chart:
First let’s add the Helm chart to your repository
helm repo add splunk-otel-collector-chart https://signalfx.github.io/splunk-otel-collector-chart
Next let’s install the chart downloaded by overriding the default values in the chart with those in values.yaml
helm install my-splunk-otel-collector -f values.yaml splunk-otel-collector-chart/splunk-otel-collector
This creates a DaemonSet object that spins up a single pod in every node of the cluster. Deploying this configuration is enough to get you all the pod / container level logs in the cluster including all components logs in the kube-system namespace a.k.a. control plane. In case, the control plane does not get the otel-collector pod scheduled, check the toleration required to schedule the pod in the control plane node. By default, the toleration is as below
tolerations:
– key: node-role.kubernetes.io/master
effect: NoSchedule
But sometimes the node-role for the control plane may not be master but control-plane. If so, the values.yaml need to have the above toleration added with the master replaced by control-plane in your cluster.
Now what if we want to get some node-level logs like syslog, audit logs etc. Let’s look at the configuration to achieve this.
logsCollection:
extraFileLogs:
filelog/var-log:
include: [/var/log/syslog]
start_at: beginning
include_file_path: true
include_file_name: false
resource:
com.splunk.source: /var/log/syslog
host.name: 'EXPR(env("K8S_NODE_NAME"))'
com.splunk.sourcetype: syslog
com.splunk.index: os
agent:
extraVolumeMounts:
- name: var-log
mountPath: /var/log
extraVolumes:
- name: var-log
hostPath:
path: /var/log
The snippet above helps you define extra file logs using the Filelog receiver. This receiver is part of the spec for the OpenTelemetry Collector and not specific to the Splunk flavour.
Let’s look at each attribute:
logsCollection:
containers:
enabled: true
The container logs are enabled using the above configuration. We don’t need to do this in our values.yaml because it’s enabled by default.
Similarly we can also enable journald logs on specific units as below but this is disabled by default. Assuming we need journald entries for kubelet and containerd units which is being written to /var/log/journal, below would be the configuration under logsCollection
journald:
enabled: false
directory: /var/log/journal
- name: kubelet
priority: info
- name: containerd
priority: info
index: ""
For any other log files that we might need from the nodes, you’d define a filelog receiver, say var-log, for it
extraFileLogs:
filelog/var-log:
include: a list of files/patterns of file paths to read
start-at: whether to start reading the files at the beginning or end. If end is specified only contents written after the startup will be read.
include_file_path: flag to set file path as attribute log.file.path
include_file_name: flag to set file as attribute log.file.name
resource: This can be used to assign key value pairs to the entry such as metadata Splunk expects like source, sourcetype, index, host.
Give special attention to the host.name attribute where an expression to read the environment variable – K8S_NODE_NAME – is given. I will link documentation on how to construct expressions like this.
What if we need to monitor multiple files?
It’s really simple – just specify another filelog receiver under the extraFileLogs.
What if I want to secure the data with TLS encryption?
Simply update the values.yaml file by updating the splunkPlatform attribute with below child attributes
splunkPlatform:
insecureSkipVerify: false
caFile: ""
clientCert: ""
clientKey: ""
Let’s go through each attribute quickly
insecureSkipVerify: This needs to be updated to false to enable certificate verification
caFile: Contents of the PEM-formatted CA certificate for the Splunk instance which in our case is the CA for the serverCert configured for the HEC input
insecureSkipVerify: false
caFile: |
-----BEGIN CERTIFICATE-----
<<certificate content>>
-----END CERTIFICATE-----
The indentation of the content is important here and should be to the right of the caFile attribute. These contents are then stored as a secret called – splunk-otel-collector – in Kubernetes just as the HEC token.
If you want client certificate verification also, you can make use of below attributes.
clientCert: Contents of the PEM-formatted CA certificate for this client
clientKey: Contents of the private key file for the client
Note that in all the above cases simply providing the certificate/key file path won’t work and contents need to be provided in PEM format as in the above example.
Example Configuration
Let’s look at an example configuration that makes use of the above.
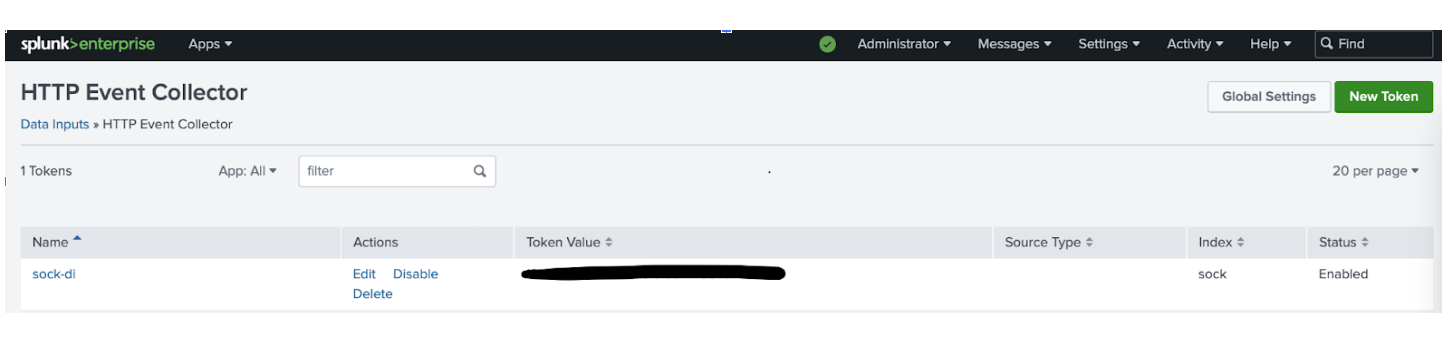
First I created an index named sock and configured a HEC token in my Splunk Enterprise instance to receive data into this index.
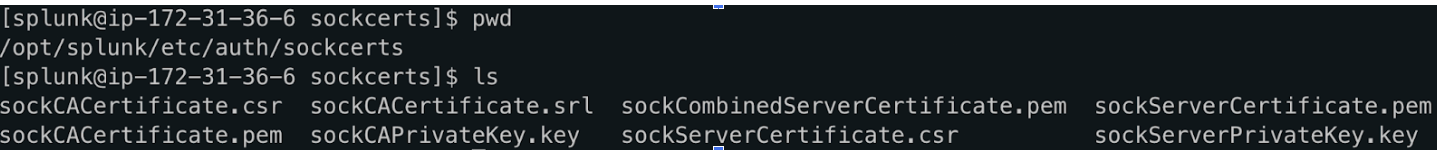
Then I generated a self signed CA and server certificate based on the Splunk documentation.
Note that while generating the server certificate, we need to add SAN (Subject Alternate Name) otherwise we would get the below error in the exporter.
"error": "Post \"https://<SPLUNK_HEC_ENDPOINT>:8088/services/collector\": x509: certificate relies on legacy Common Name field, use SANs instead"
Likewise the SAN also needs to have not just DNS but IP entries as well to avoid getting the below error in the exporter.
"error": "Post \"https://<SPLUNK_HEC_ENDPOINT>:8088/services/collector\": x509: cannot validate certificate for <SPLUNK_HEC_ENDPOINT> because it doesn't contain any IP SANs"
The next step is to configure the self-signed server certificate to be used with the HTTP Event Collector.
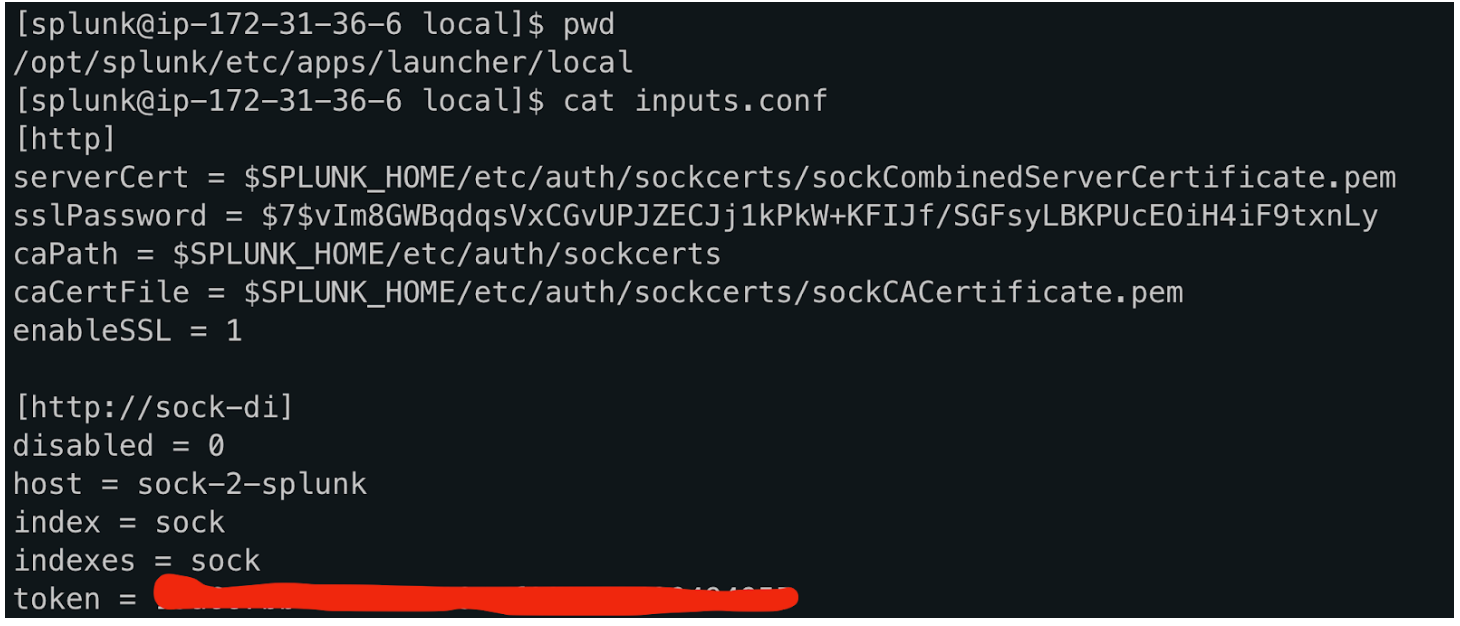
Now that we have the HEC listener configured we can test the TLS connection by sending a test message from one of the nodes.
ubuntu@cplane1:~$ curl --cacert sockCACertificate.pem https://<SPLUNK_HEC_ENDPOINT>:8088/services/collector -H "Authorization: Splunk <token>" -d '{"event":"Hello world!"}'
If the message has reached the destination, we can go ahead and configure the helm chart with below values.yaml.
ubuntu@cplane1:~$ cat values.yaml
tolerations:
- key: node-role.kubernetes.io/control-plane
effect: NoSchedule
clusterName: "sock-di"
splunkPlatform:
endpoint: "https://<SPLUNK_HEC_ENDPOINT>:8088/services/collector"
token: "<hec_token>"
index: "sock"
insecureSkipVerify: false
caFile: |
-----BEGIN CERTIFICATE-----
<CA CERTIFICATE CONTENT>
-----END CERTIFICATE-----
logsEngine: "otel"
cloudProvider: ""
logsCollection:
containers:
excludeAgentLogs: true
extraFileLogs:
filelog/var-log:
include: [/var/log/syslog]
start_at: beginning
include_file_path: true
include_file_name: false
resource:
com.splunk.source: /var/log/syslog
host.name: 'EXPR(env("K8S_NODE_NAME"))'
com.splunk.sourcetype: syslog
com.splunk.index: sock
agent:
extraVolumeMounts:
- name: var-log
mountPath: /var/log
extraVolumes:
- name: var-log
hostPath:
path: /var/log
Note that I have removed my HEC endpoint, token value and certificate content.
Let’s deploy the helm chart with the values.yaml.
ubuntu@cplane1:~$ helm install di-sock -f values.yaml splunk-otel-collector-chart/splunk-otel-collectorNAME: di-sockLAST DEPLOYED: Mon Apr 10 20:05:39 2023NAMESPACE: defaultSTATUS: deployedREVISION: 1TEST SUITE: NoneNOTES:Splunk OpenTelemetry Collector is installed and configured to send data to Splunk Platform endpoint "https://<SPLUNK_HEC_ENDPOINT>:8088/services/collector".
Check the pod logs to make sure there are no errors.
ubuntu@cplane1:~$ kubectl get podsNAME READY STATUS RESTARTS AGEdi-sock-splunk-otel-collector-agent-dqvhd 1/1 Running 0 120mdi-sock-splunk-otel-collector-agent-psqdt 1/1 Running 0 120mdi-sock-splunk-otel-collector-agent-wpnts 1/1 Running 0 120m
ubuntu@cplane1:~$ kubectl logs di-sock-splunk-otel-collector-agent-wpnts --tail=22023-04-10T20:05:42.574Z info fileconsumer/file.go:184 Started watching file {"kind": "receiver", "name": "filelog/var-log", "data_type": "logs", "component": "fileconsumer", "path": "/var/log/syslog"}2023-04-10T20:05:42.574Z info fileconsumer/file.go:184 Started watching file {"kind": "receiver", "name": "filelog", "data_type": "logs", "component": "fileconsumer", "path": "/var/log/pods/default_di-sock-splunk-otel-collector-agent-wpnts_d00ed25f-4249-4111-b358-ab04c892da1a/migrate-checkpoint/0.log"}
Make sure you can search the logs in Splunk Enterprise.
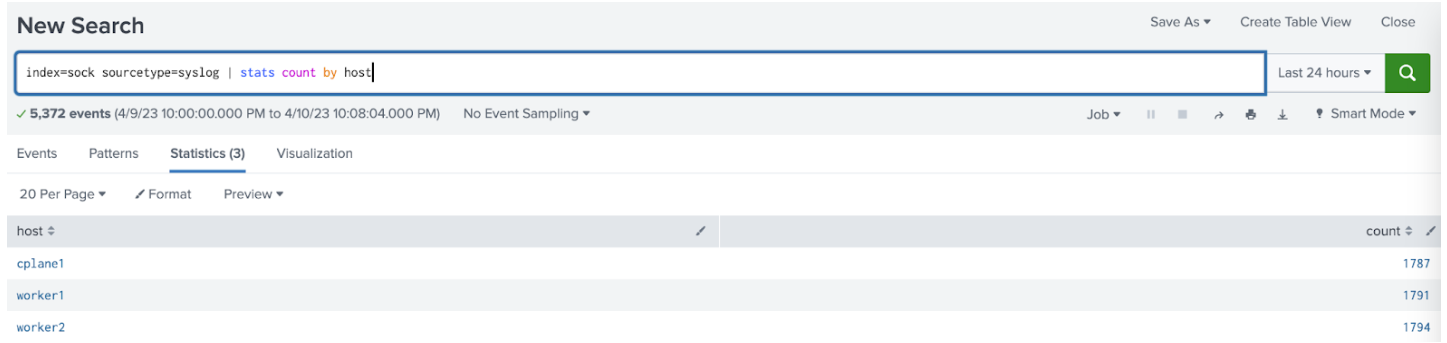
Success! We just had a look at the basic plumbing between Splunk Otel Collector for Kubernetes and Splunk Enterprise. In the next instalment, we’ll look at some advanced processing of logs within the pipelines of the collector.
Resources:
Overview of the Splunk Distribution of OpenTelemetry Collector
splunk-otel-collector-chart/advanced-configuration.md at main
splunk-otel-collector-chart/values.yaml at main
Language Definition – antonmedv/expr · GitHub
https://docs.splunk.com/Documentation/Splunk/9.0.4/Security/Howtoself-signcertificates
© Discovered Intelligence Inc., 2023. Unauthorized use and/or duplication of this material without express and written permission from this site’s owner is strictly prohibited. Excerpts and links may be used, provided that full and clear credit is given to Discovered Intelligence, with appropriate and specific direction (i.e. a linked URL) to this original content.


