Diving into Splunk Table Datasets
Splunk’s Table Datasets feature was first introduced in version 6.5. It added the ability to manipulate data in a tabular form for users who are unfamiliar with Splunk Search Processing Language (SPL). Users can generate reports, tables and pivot models to extract operational knowledge from their data.
The features were further enhanced in Splunk 6.6. The added capabilities in the Dataset explorer include:
- Expanding Dataset explorer in two views – View Results and Summarize Fields
- Export content of a Dataset
- Set the Dataset time range
- Schedule Dataset as a report
- Accelerate Datasets
Getting Started
Users in Splunk can perform most management functions through the Dataset explorer. However, to create Table Datasets and utilize all the management capabilities, you will need to install the Splunk Dataset add-on from Splunkbase — https://splunkbase.splunk.com/app/3245/
Creating Table Datasets
The Dataset add-on makes it incredibly easy for anyone to prepare data for analysis by creating simple and easy to understand tables from raw data.
From the Splunk search and reporting app navigate to ‘Datasets’ in the search bar. If the Dataset add-on is properly installed and enabled, you will see an option ‘Create New Table Dataset’.
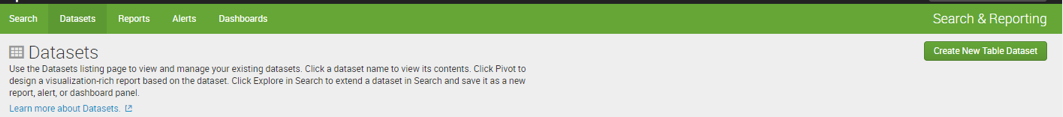
The next window will allow you to choose between 3 starting points for creating your Table Dataset: Indexes & Source Types, Existing Dataset, and Search.
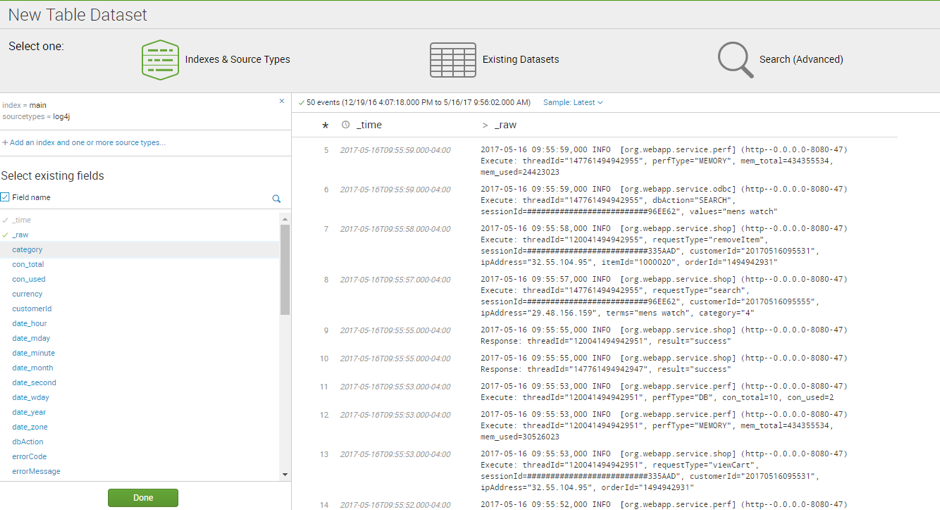
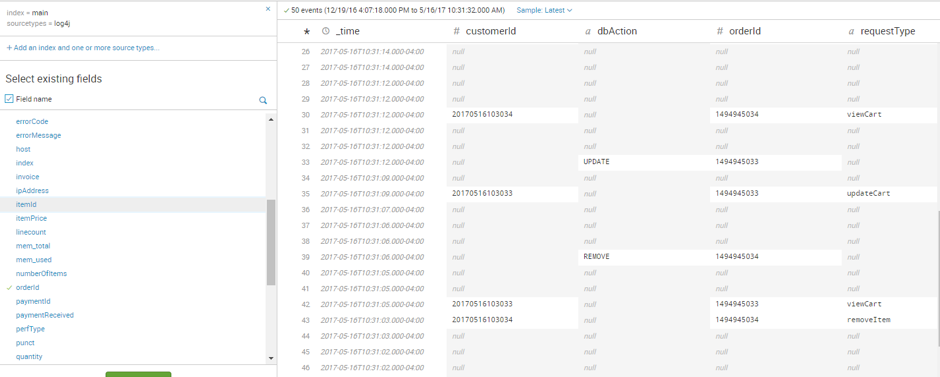
Selecting Indexes & Source Types provides a simple starting point to interact with data and immediately as it will preset all of the indexes and source types available to you. The fields extracted from the data sources are listed below the ‘Select existing fields’ menu. You can select the relevant fields required for analysis and reporting purposes. All this is accomplished without writing any complex SPL!
Viewing Datasets
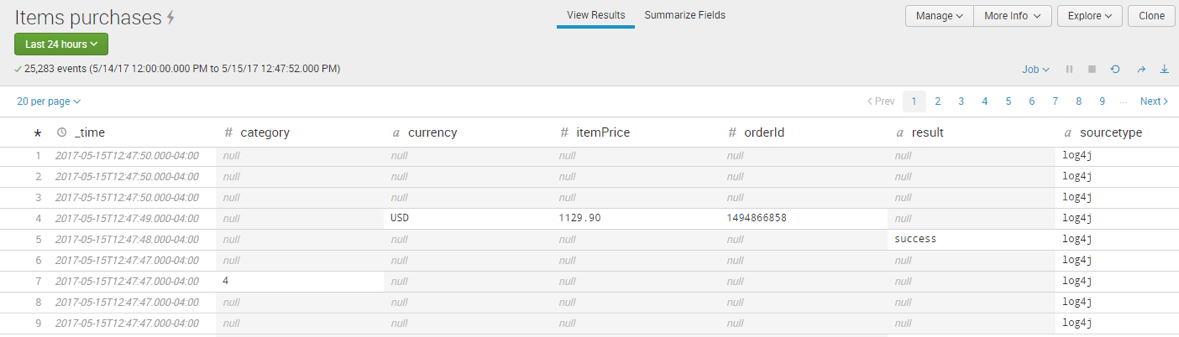
The Datasets explorer will display all of the prepared Datasets. Just click on the Dataset that you want to analyze. The default view for Datasets is ‘view results’. This view presents the data in a tabular format over a time range allowing for data to be displayed in a simple and easy to read manner with values in rows and columns.
Summarize Fields
The Summarize Fields view returns analytical and statistical summary of each field (column). We can see the variables for mean, median, mode and percentages for values types. In addition, summarize fields displays the top values of each column, removing the complexity that users may face when transforming and aggregating raw data through search.

Common Management Features for Explorer Views
In Splunk 6.5 you had to ‘Explore’ the Dataset in the search window to change the time range picker adding time and extra steps to get the relevant metrics. In comparison, Splunk 6.6 allows you to change the time range within the data explorer window for both views: View Results, Summarize Fields. This allows for a much more streamlined, and efficient, user experience.

From the ‘Manage’ dropdown menu you also able to extend the Dataset as a report, change permission, delete or accelerate data model. These features allow greater management of Datasets to understand and extract operational knowledge from your raw data with ease.
For information on exploring other management features such as job actions or understanding dataset types you can visit: http://docs.splunk.com/Documentation/Splunk/latest/Knowledge/Exploreadataset
Looking to expedite your success with Splunk? Click here to view our Splunk service offerings.
© Discovered Intelligence Inc., 2017. Unauthorised use and/or duplication of this material without express and written permission from this site’s owner is strictly prohibited. Excerpts and links may be used, provided that full and clear credit is given to Discovered Intelligence, with appropriate and specific direction (i.e. a linked URL) to this original content.


