
Becoming a Dad: A Data Story using Splunk

This blog post is not technical in nature whatsoever, it’s simply a fun story about two passions; Becoming a first time father and Splunk. So sit back, grab your beverage of choice and let me tell you a little data story about how I Splunk’d myself Becoming a Dad.
I never really expected to share this story but earlier this summer I had the opportunity to speak in front (well, virtually of course) of my fellow SplunkTrust members at the SplunkTrust Summit so I thought why not share the story about how I decided to use Splunk to understand what it was like becoming a dad for the first time. Ok, but why am I only blogging about this now, especially since my son is now 2 years old? Well Splunk .conf20 has just come to a close and I was inspired by a lot of the fun use cases and stories being shared in the Data Playground and I thought it was time to sit down and write about my data story.
Now if you’d simply prefer to watch my presentation from the SplunkTrust Summit rather than read about it here, you can certainly do so by navigating to the video on our YouTube channel.
Before I begin, I must also give a shout out to my amazing wife, Rachel, who without her strength and positivity this data story simply would not be possible.
The “News”
In early January 2018 my wife shared with me the exciting news that we were going to be first time parents. Naturally in the days, weeks, heck even months to follow a lot of questions entered my mind; What is it like? How to prepare? What to expect? and so on. Well of course, everywhere you turn everyone has their own experience to share but it’s exactly that, their own experience. So I thought, when someone asks me about my experience in the future I want to have the best understanding possible. I want to be able to look back at it, better understand what it was like and have the ability to ask questions of the experience after the fact so, of course, why not Splunk becoming a dad? And that’s exactly what I did.
The Questions
To know where to begin I started out with asking myself, what questions would I want to answer about the process of becoming a dad? When talking to other parents about their experience no one ever shied away from sharing the ups and downs, “I slept only one hour a night” … “The experience was beautiful, no stress” … “It all happened real fast” and so on.
So I thought what if for myself I could answer some of these basic questions:
- Am I even getting any sleep?
- Is my sleep consistent or just completely broken?
- Am I getting any exercise walking and carrying our new baby around?
- What was my heart rate like leading up, during the birth and after?
- Did I experience a high heart rate (stress) during certain milestones of the process?
The Data
To answer the questions knowing what was a head of me, I really wanted to focus on keeping the data collection simple and not have to worry about instrumenting much or having something break and lose out on that data collection. So to achieve that simplicity I bought myself a Fitbit Alta HR. The Fitbit was capable of tracking heart rate, sleep, calories burned and of course steps all while having good battery life with a small and comfortable design.
I collected the Fitbit data by writing a simple python script to call the Fitbit API and collect all of the stats I was looking for.
Admittedly, I did have one other data set to work with after my son was born that I did not foresee at all and that was his diaper change log written out as a Splunk lookup. Yup, I went that far.
The New Daddy Dashboard
After my son was born and all of the data had been collected and indexed in Splunk (don’t worry, I waited a month to do this, it wasn’t immediately after he was born :)) it was time to begin to answers those questions that I started out with and build myself a dashboard.
Enter The New Daddy Dashboard, a visual representation of the questions I wanted to originally answer and more questions I realized I had after I had the data. The data spans the three weeks before my son was born up to six weeks after.
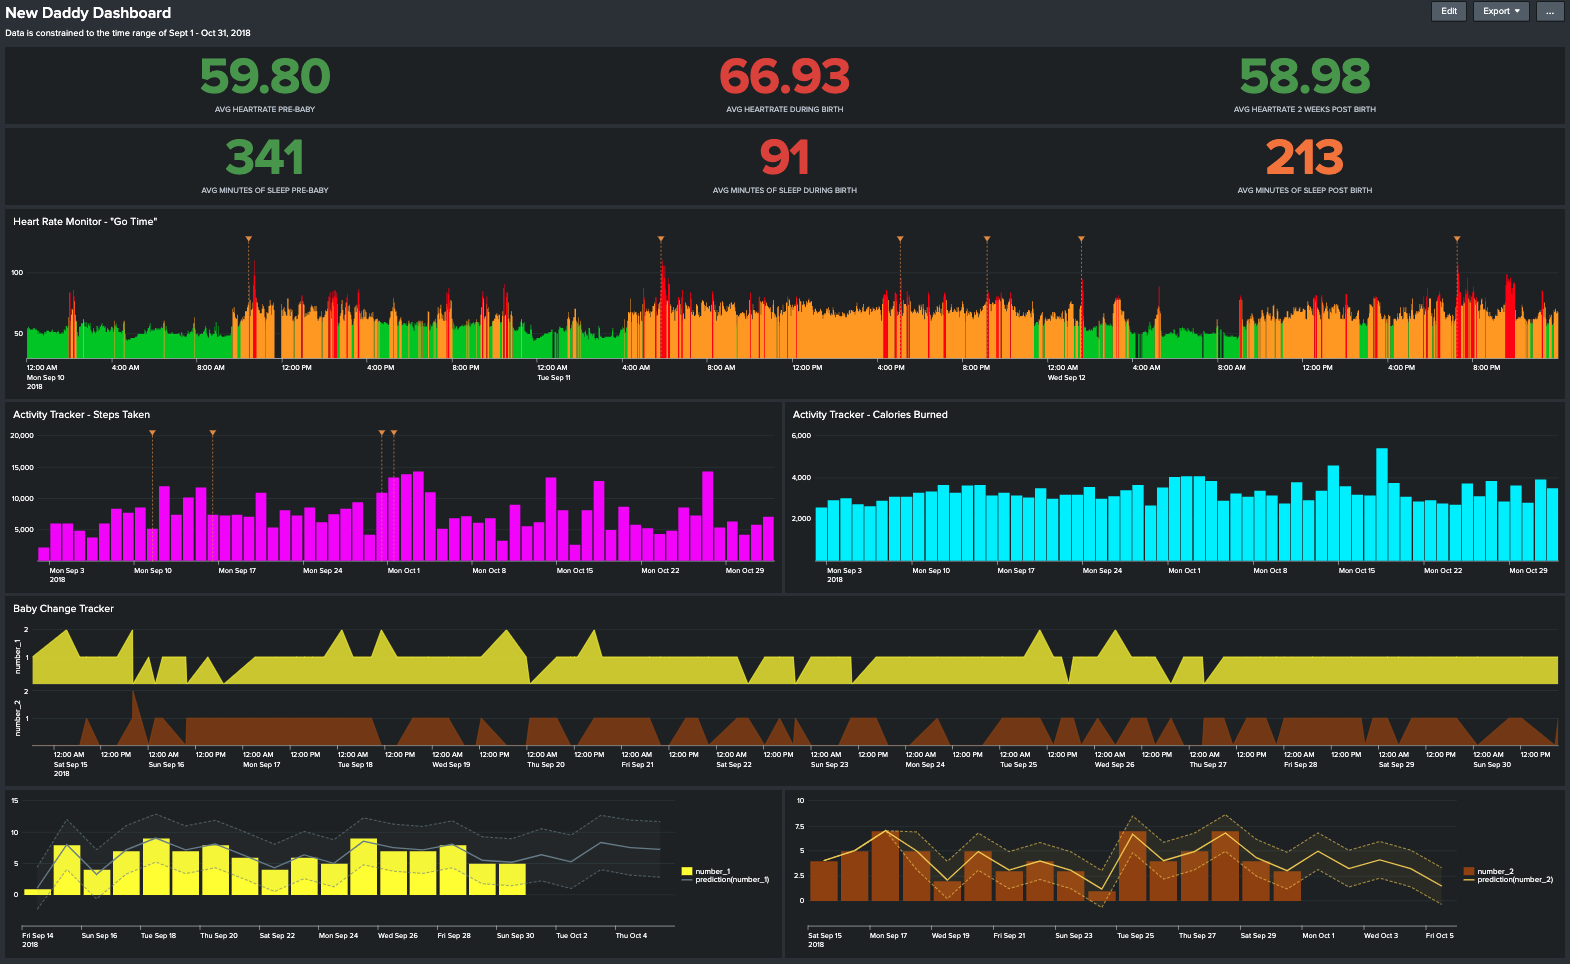
There is certainly a lot going on within this dashboard so let’s break it down.
First, I started off with averaging out my heart rate and sleep. This is broken out into three time range’s, the time leading up to my son being born (“Pre-Baby”), the 48 hours when he was born (“During Birth”) and the two weeks following (“Post Birth”).

The questions we are answering here were, am I getting any sleep and how was my heart rate? Well it went pretty much as I expected, the 48 hour period during birth my average heart rate shot up and my sleep was almost non-existent each day. No real surprises there however you will notice that my average minutes of sleep post-birth dropped quite a bit from where it was pre-baby. Needless-to-say I did not really take the advice of “sleep when your baby sleeps” and it cost me.
Next, I was interested to see how I handled what I call “Go Time”, which you guessed it, labour is happening, baby is coming and ultimately the baby is here. What I created was a visualization charting my heart rate over this time frame; green representing a normal heart rate range, yellow a moderately high heart rate and red being a very high heart rate. Additionally on this chart I added annotations to mark each major “milestone” of the experience.
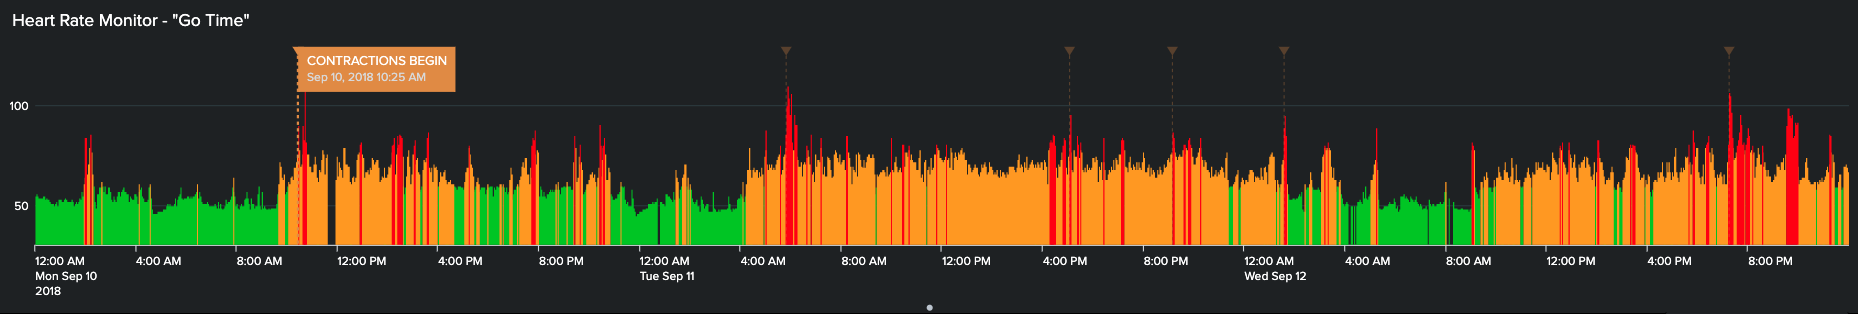
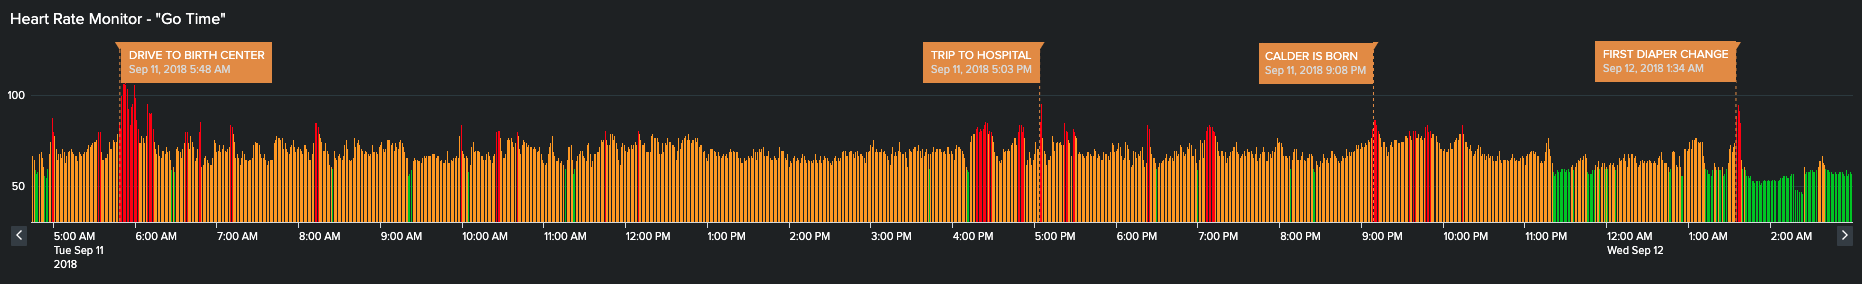
What I could see here is what I kind of expected of myself, my heart rate would quickly rise as the stress grew with each major milestone encountered; labour starting, driving to the birth center, the trip to the hospital, my son’s birth, my first ever diaper change and our first few hours after leaving the hospital.
If we zoom in on this timeline you can see the correlation of high heart rate to milestone much clearer and how after leaving our home for the birth center my heart rate rarely ever went down until after I changed my first ever diaper and thought ‘ok, I got this’.
Now that I knew the answer to the question “Did I experience stress during this process?” it was time to move on to figure out if I actually got any exercise. Again, an answer that probably is not going to be shocking at all.
Looking at these charts what I could see was that exercise came and went. The couple days that we spent at the hospital after my son was born there was a good bit of walking mainly for the desire to be out of the hospital room. Then really after that exercise went out the window with funny enough the only consecutive spikes in the chart were for when I attended Splunk .conf18 in Orlando.
To round out The New Daddy Dashboard I decided to have a little bit of fun with that unexpected data set I mentioned earlier. I created a set of charts which I called the Baby Change Tracker, for you guessed it, diaper changes. Even writing this now it still makes me laugh that my wife and I tracked this.
I’m pretty sure the colors are a dead give away about the data so I wont elaborate on that but what I was trying to see here was two fold; were there any consistencies or patterns to the types of activity driving the diaper change and could we start to predict and forecast the diaper changes?
Where I landed with this analysis was that, although we could start to see patterns in the data I still had a very unpredictable baby, as Im sure we all do, but in the end (no pun intended) it was still fun to visualize this data and this blog post is something I’m sure my son will look back on one day and go ‘why dad, why?!‘.
What I Discovered Becoming a Dad
In the end what did I discover and what did Splunk show me about becoming a dad?
- Get exercise before hand; your heart will thank you.
- Expect the unexpected; there’s very little predictability.
- You’ll get little-to-no Sleep; but take whatever you can get!
- Get up and walk; not just at the hospital.
- It’s one heck of a ride, enjoy it!
© Discovered Intelligence Inc., 2020. Unauthorised use and/or duplication of this material without express and written permission from this site’s owner is strictly prohibited. Excerpts and links may be used, provided that full and clear credit is given to Discovered Intelligence, with appropriate and specific direction (i.e. a linked URL) to this original content.

