Splunk Enterprise 6.5 New Features – Part I
New Features in Splunk Enterprise 6.5!
The release of Splunk Enterprise 6.5 brings improvements to the user experience and added capabilities to more easily manage the environment. The ability to perform a wider range of Splunk operations directly through the UI (user interface) is definitely a feature welcomed by Splunk users. The UI not only enabled better management of your Splunk environment, but it also simplifies the process of presenting information. The list of new features includes:
| Key Feature | User Experience |
Conditional Table Formatting & Number Formats |
| Table Summaries | ||
| Dashboard Refresh | ||
| Dashboard Edit Experience | ||
| Table Datasets | ||
| Search IDE | ||
| Search Job Manager & Inspector | ||
| Management | Platform Health Check | |
| Data Rebalance in Indexer Clusters | ||
| Instrumentation | ||
| Platform | Indexer Clustering Enhancements | |
| Search Head Clustering Enhancements | ||
| SAML Integration | ||
| Machine Learning Toolkit | ||
| Develop | Custom Alert Action – Search-driven Dropdowns |
In order to try out a few of the new features a simple virtual environment was created. The virtual environment consisted of a single Search Head, Indexer Cluster (two indexers), a Master Node and a Universal Forwarder. The Universal Forwarder was used to monitor and send data from a CSV which included data related to Parking Fines in Toronto, Canada during the year of 2015.
Management / Platform Improvements
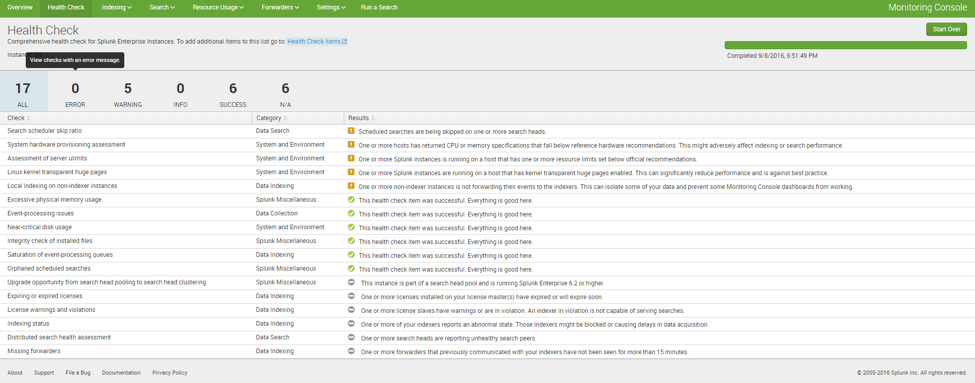
After repairing the indexers I looked at the new Health Check feature to investigate the stability of the environment. The Health Check can be performed from the Monitoring Console app. All the user needs to do is select Start and Splunk will run a series of checks to determine the stability of the environment and notify the user of any warnings or errors.

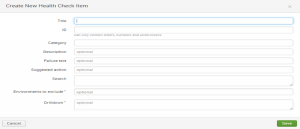
On top of the default health checks you can create your own Health Check Items.

Table Datasets
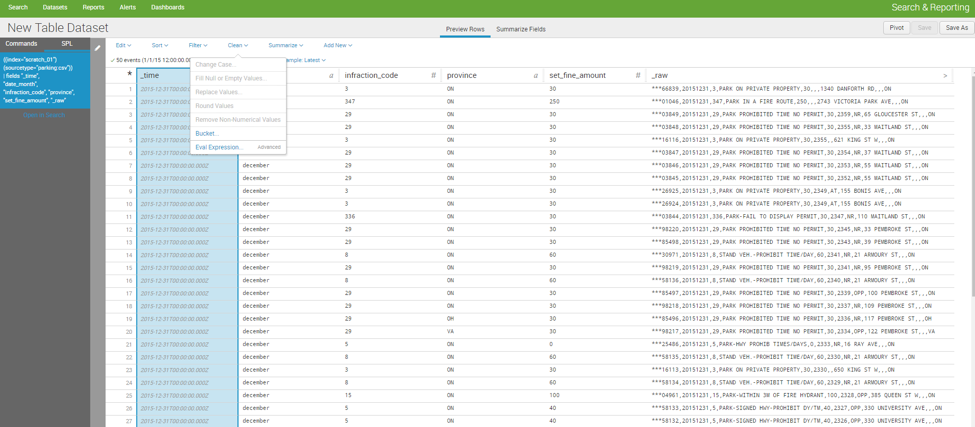
Now that my virtual environment is stable, it is time to ingest the data and examine it. In Splunk 6.5 any source data and searches can be converted into objects called datasets. This feature simplified the process of cleaning data tables and identify anomalous values. Creating the dataset was easy enough. Once you select an index, sourcetype and the fields a table is automatically generated. Directly through the UI I have the capability to round numbers, create eval expressions, fill null values, create summary stats, join lookup tables, etc. Any manipulation done to the dataset is conveniently captured in the top left hand corner in Splunk SPL.

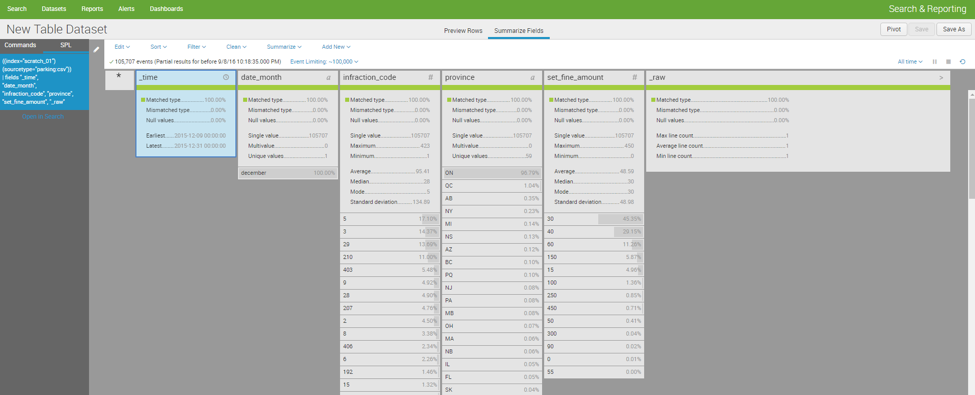
The same page has a tab to summarize the field values. This page shows statistics on the fields selected for the dataset, such as: how many multi-values exist, the number of unique values, averages, median, standard deviation, the number of times a specific value occurs, etc.

In the next blog post we will take a look at the new Splunk Enterprise 6.5 Search IDE and Dashboard features.
Looking to expedite your success with Splunk? Click here to view our Splunk service offerings.
© Discovered Intelligence Inc., 2016. Unauthorised use and/or duplication of this material without express and written permission from this site’s owner is strictly prohibited. Excerpts and links may be used, provided that full and clear credit is given to Discovered Intelligence, with appropriate and specific direction (i.e. a linked URL) to this original content.

